(SEO This Week) – On November 4, 2021, with little fanfare, Google announced that they are bringing the Page Experience update to the desktop search results. Considering Google, in multiple previous statements, has said that Google was transitioning to a Mobile-only indexing system. If that’s the case, why deploy a desktop version at all?
And, frankly, does it even matter at this point in regards to rankings?
First, let me say that to this day I still offer a Page Speed Optimization service for WordPress because I believe that a fast-running website is good for the user and conversions on a site. I am by no means advocating for you as a website owner to NOT do page speed optimization.
However, ever since the Core Web Vitals tool was launched by Google and the major SEO publications began promoting the results as the next ranking factor I was skeptical and publicly said that I didn’t ‘believe’ that it would ever be a ranking factor that was any more significant than page speed itself.
Meaning, I believe that if your site was very slow and you optimized it for speed and made significant changes that you very well could obtain higher rankings. However, if your website was already “fast enough” and you optimized it, even more, you’d be less like to see any ranking improvement whatsoever.
I can’t tell you how many jobs I’ve turned away for my simple low-cost service because I didn’t feel the owner of the site would get much value out of the work performed.
I also never jumped on the monetization gravy train that was (and still is) Core Web Vitals.
I recently held a poll in SEO Signals Lab asking how many people were charging for Core Web Vitals optimization as a singular service outside of their normal page speed work.
It’s interesting to see how many people were charging hundreds of dollars (and some in the comments mentioned the word ‘thousands’) for work that they didn’t know would provide an SEO benefit.
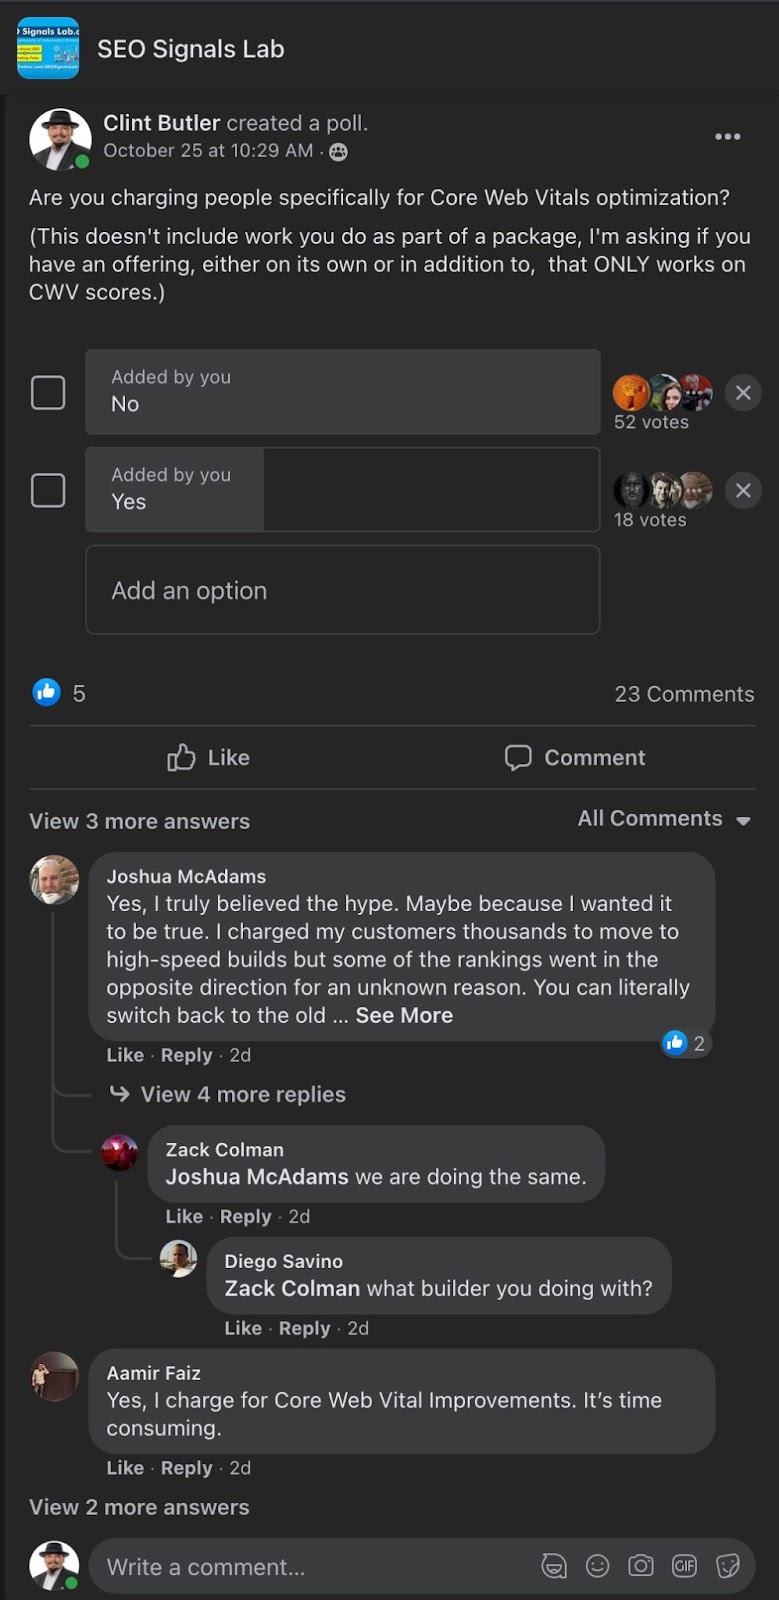
Honestly, knowing the nature of that group, I would venture to say that not everyone who was/is charging for the work responded to the question. I back that up with the number of people that responded to this poll.

Because of how I framed the second question up top there I imaging that maybe all 123 people were not charging for the optimization work as a service. After all, when I started page speed optimization as a service there were maybe three providers tops ranking the in the search results.
It wasn’t until long after that the ‘experts’ fell out of the rafters and started offering similar services. But I digress.
In May 2020 Google announced Core Web Vitals and even held a live event kicking off the web.dev website that was focused on the new tool.
The new tool was supposed to help you make your site better for users to increase engagement, which is a very good thing.
Then, someone at Google announced that Core Web Vitals would be a ranking factor on 10 November 2020.
From that point on, SEO’s were on Core Web Vitals like a hobo on a hotdog.

They were all falling over themselves telling people that they should spend hours on their websites because this ranking factor would be the most important yet.
And business owners bought it, literally.
Thankfully, because it would probably make many people sick, we don’t know the real dollar amount this campaign cost businesses. However, I do have insight into a few businesses that spend money and those folks combined spent well over $100,000.
That number doesn’t include in-house man-hours.
Now, being me, and seeing how Google did this to SEO’s once before (HTTPS ranking factor anyone?) I advised my clients to ignore CWV and worry about user experience. The actual experience, not some “score” or “grade”. My favorite line was, my last grade was in college, this is business and the only grade that matters is sales.
Some listened, some didn’t, neither saw a ranking improvement after they outsourced the work.
But their websites were easier for users to use, so not a complete loss.
That brings us to June 15, 2021, when Google announced they are rolling out the Page Experience Update. I smelled a rat instantly when they said it would take until the END of August for the rollout to be complete.
I mean, sure it would take some time to reshuffle the ranking results, but a full month and a half, please.

And they call me “black hat”.
So August comes and goes and SEO’s start talking about the impact Core Web Vitals has had on the search results.
Frankly, it was like playing a game of where is waldo to find one that could definitively say their Core Web Vitals optimizations alone before the update resulted in rankings improvements after the update.
If you find this SEO, let me know so we can examine their site, here is a picture of who you’re looking for:

That brings us to September 22, 2021, and an SEO Fight Club episode on the topic of Core Web Vitals.
In that episode, Lee Witcher (pretty sure I spelled his name right if not, it’s ok because I think he might actually be a witch), outlined his argument of why he thought CWV is not a ranking factor based on data that he collected.
A bit later, Ted Kubaitis did another test using Google’s own script they wanted webmasters to put on their sites to feed Google Analytics CWV data, and he suggested that the script was actually a random number generator.
From that day on, I buried myself in data and Excel hell just for you!
So let’s get our nerd on.
Test Setup: I don’t know that test setup is the right word since this is really all about data collection.
So first let’s start with this Google script they wanted to be added to websites.
Measure and report Core Web Vitals with the web-vitals library
I honestly have no idea how Ted found that, but there it is, Google even made a site with simple step-by-step instructions to tell you how to implement it.
By it, I mean this script:
<script type=”module”>
import {getCLS, getFID, getLCP} from ‘https://unpkg.com/web-vitals?module’;
getCLS(console.log);
getFID(console.log);
getLCP(console.log);
</script>
Pretty simple right?
Well, basically what it does is, when you load a page the FID and LCP metrics are collected and sent to Google.
When you leave the page, the CLS data is sent to Google.
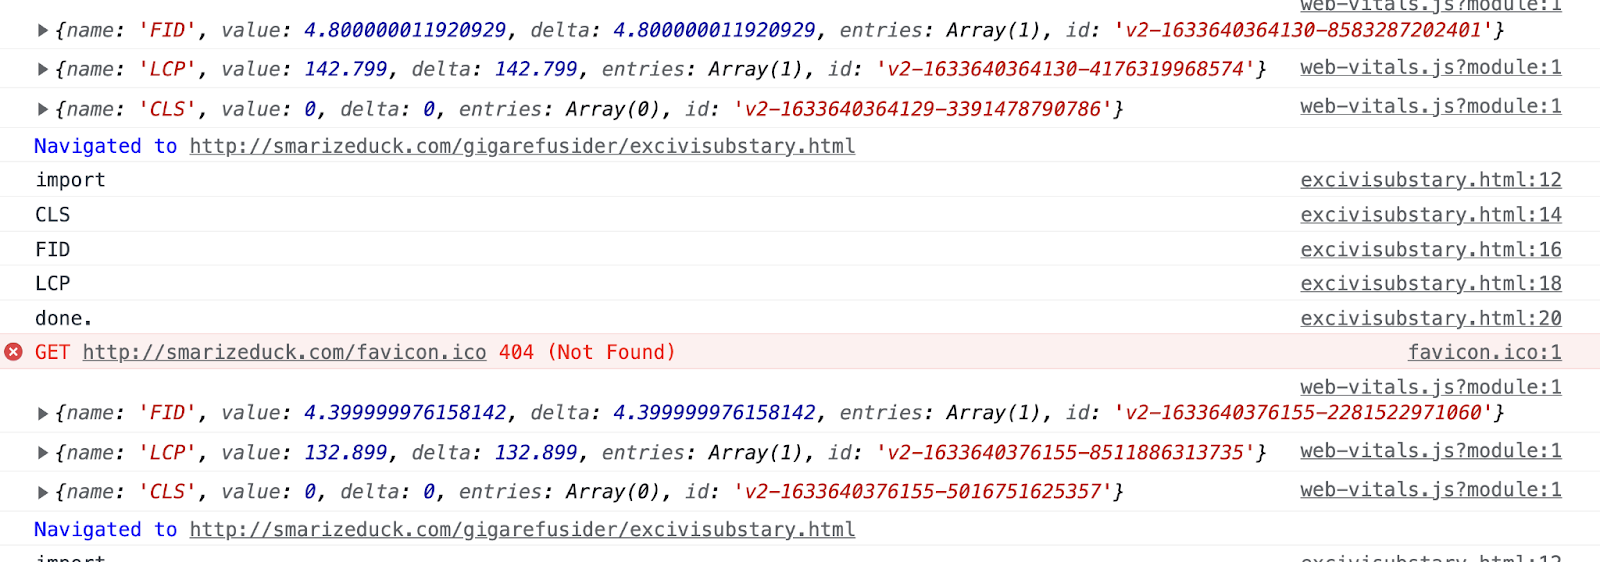
All of this can be seen in the log in your Chrome Inspect tool.
In there, it all looks like this:

Do you notice anything?
I’ll wait…
See it yet……

Remember how I told you how we see the data, in your Chrome browser.
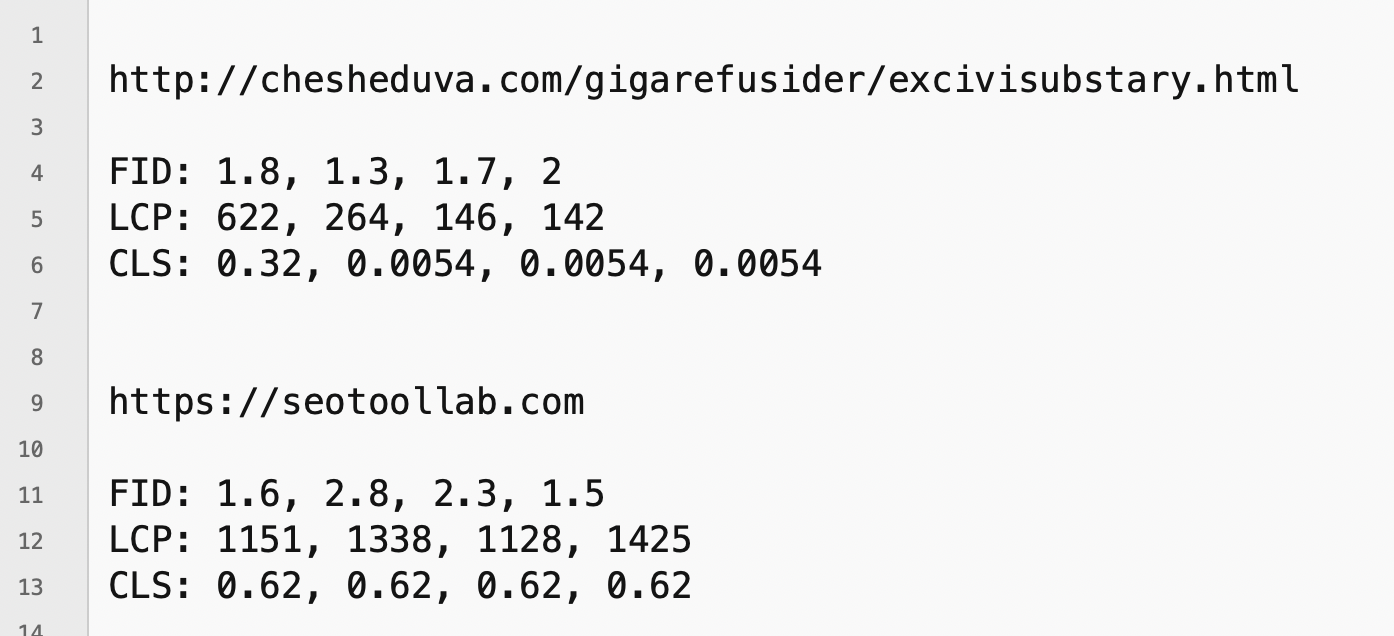
So, same user, same computer, same internet provider, same machine, same browser, same IP, same URL.

There is no way those numbers should be so far off.
I mean, variance ok, I get that, we will see that. But that much variance, not a chance.
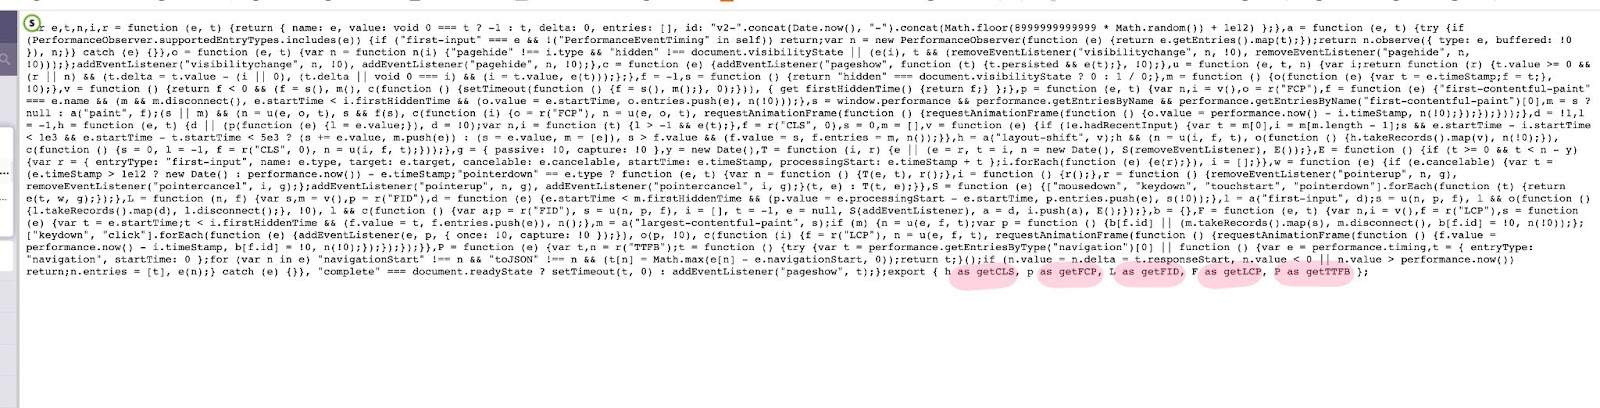
Ted pointed to something in the Javascript file running this thing that pretty much explains it:

Math.random
Really Google, really…
So now we know why the random numbers.
But when I looked a bit closer, I saw that this thing was actually reporting more data than Google’s own install guide let on.
Look closer:
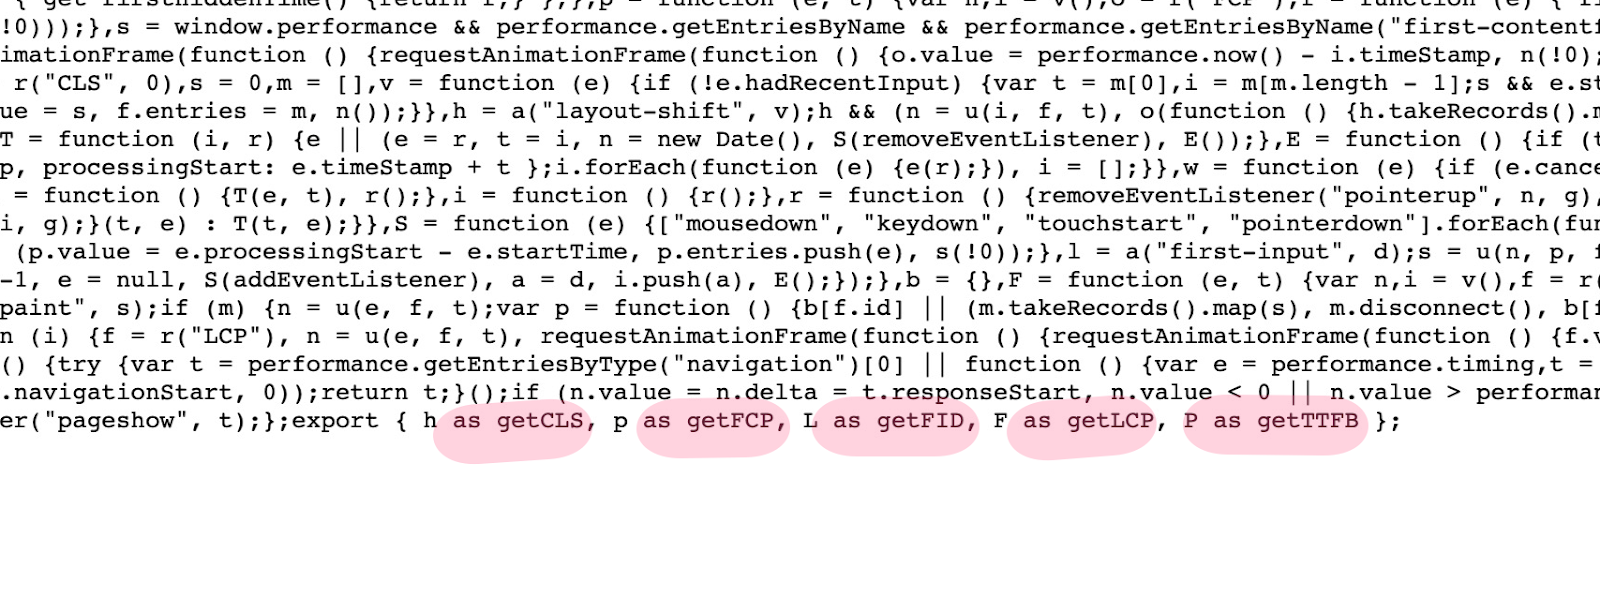
They want you to install this and they can’t even tell you ALL the data points that it’s really collecting.
So I rewrote the Javascript they provided.
<script type=”module”>
console.log(“import”);
import {getCLS, getFID, getLCP} from ‘https://unpkg.com/web-vitals?module’;
console.log(“CLS”);
getCLS(console.log);
console.log(“FID”);
getFID(console.log);
console.log(“LCP”);
getLCP(console.log);
console.log(“done.”);
</script>
And I put it on Digitaleer.com, my own website.
Not even a fake keyword site.
All the numbers still came back random.
If you want to see for yourself, you really should, go to the Google site and check out more about the script and how to use the Inspect tool to read the data.
Then go look at all these URLs with the script on them (the script has been removed and most of these sites/URLs have been taken down at the time of publishing).
seotoolslab.com
digitaleer.com
and these test pages with various different elements.
YouTube with Embed Responsively
https://devicturs.com/gigarefusider/excivisubstary.html
Google Map with Embed Responsively
https://exciolening.com/gigarefusider/excivisubstary.html
Has SEOToolsLab.com embedded
https://explaidecoucts.com/gigarefusider/excivisubstary.html
Has YouTube video
https://goniorifying.com/gigarefusider/excivisubstary.html
Has Google Map
https://recliculetizes.com/gigarefusider/excivisubstary.html
Has Amazon Hosted Image+
https://smarizeduck.com/gigarefusider/excivisubstary.html
Has nothing, just text
https://wagillields.com/gigarefusider/excivisubstary.html
Every one of those pages returns back random numbers.
It is the first nail in the CWV coffin, how can a ranking factor be set if the tools are returning back random numbers?
Ok, so the script is firing off random test numbers, the testing tools are not doing that.
Or are they?
This is the Core Web Vitals testing tool from WebPageTest.org.
It’s using the same API that every other CWV testing tool is using, including web.dev’s testing tool.
Same server, same user, same URL tested, same test settings all around.
Random results.
Granted, not as random as the script, but those are all back-to-back tests, they should have all been closer. Especially since it’s the same URL.
So what gives?
Well, that’s because that tool is using the Page Speed API, and guess what, that data isn’t in real-time.
It’s based on the last 28 days of gathered data. i.e. the last 28 days that Googlebot went to your website and collected all those metrics in the script.
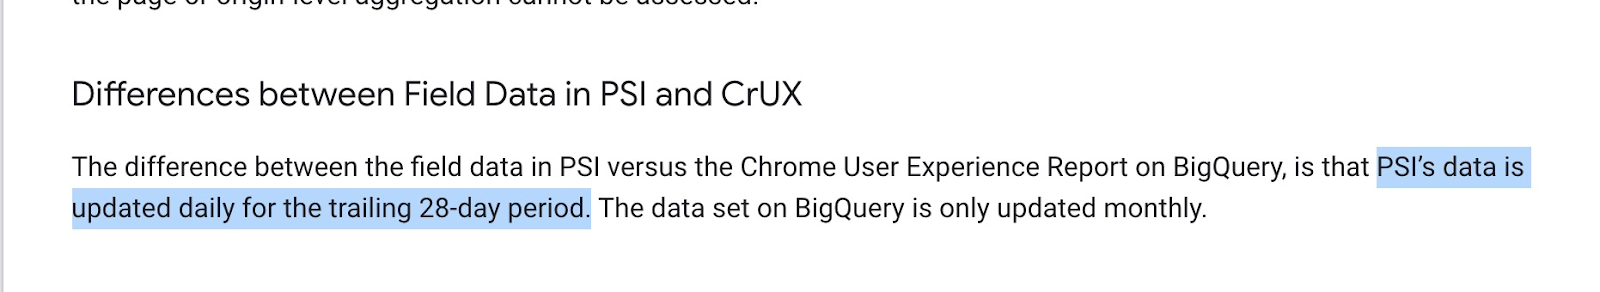
Also, note that CrUX data is only updated monthly. People who countered Lee’s argument against CWV with “Google is using the CrUX data”.
We’ll see about that.
Anyway, the API that is driving all these tools is an average of your last 28 days’ data.
That data is gathered using Javascript, regardless of if you have it installed or not, if Google wants it they are collecting it.
Then it’s even being randomized for tools using the data, which is why we see random numbers per test.
It’s the second nail in the CWV coffin, how can the average of random numbers ever be a legitimate signal as to user experience.

This is everything that the Page Speed Insights API is providing to tools about your website.
Performance Score
First Contentful Paint Time (ms)
Speed Index Time (ms)
Largest Contentful Paint Time (ms)
Time to Interactive (ms)
Total Blocking Time (ms)
Cumulative Layout Shift
Total Size Savings (Bytes)
Total Time Savings (ms)
Total Requests Total Page Size (Bytes)
HTML Size (Bytes)
HTML Count Image Size (Bytes)
Image Count
CSS Size (Bytes)
CSS Count
JavaScript Size (Bytes)
JavaScript Count
Font Size (Bytes)
Font Count
Media Size (Bytes)
Media Count
Other Size (Bytes)
Other Count
Third-Party Size (Bytes)
Third-Party Count
Core Web Vitals Assessment
CrUX First Contentful Paint Time (ms)
CrUX First Input Delay Time (ms)
CrUX Largest Contentful Paint Time (ms)
CrUX Cumulative Layout Shift
Eliminate Render-Blocking Resources Savings (ms)
Defer Offscreen Images Savings (ms)
Efficiently Encode Images Savings (ms)
Properly Size Images Savings (ms)
Minify CSS Savings (ms)
Minify JavaScript Savings (ms)
Reduce Unused CSS Savings (ms)
Reduce Unused JavaScript Savings (ms)
Serve Images in Next-Gen Formats Savings (ms)
Enable Text Compression Savings (ms)
Preconnect to Required Origins Savings (ms)
Server Response Times (TTFB) (ms)
Multiple Redirects Savings (ms)
Preload Key Requests Savings (ms)
Use Video Format for Animated Images Savings (ms)
Total Image Optimization Savings (ms)
Avoid Serving Legacy JavaScript to Modern Browsers Savings (Bytes)
Image Elements Do Not Have Explicit Width & Height
Avoid Large Layout Shifts
URL Encoded Address
The easiest way to see all this is to use ScreamingFrog, Lee explained how he gather his data with it, then I was off to the races.
Surely in all that data, there has to be a ranking factor somewhere?
So I came up with some keywords, 76 to be exact
| Cellulite Remedies Home Brewing Supplies Learn To Draw Breastfeeding Diet BitCoin Tutorials Publish Your Own Book Resume Writing Service Product Photography Truck Accessories Chef’s Knives Candle Making Cabbage Soup Diet Niche Marketing Cross Country Running Fix John Deere Tractors Business Fashion For Men How To Drive A Fishing Boat Herb Planting Adrenal Fatigue Men’s Hairstyles Brazilian Jiu Jitsu Guitar Lessons Bow Hunting DIY Homemade Dog Food Cycling Gear Best Electronic Cigarette Learn Python Best Vacation Spots Scuba Diving Vintage Wedding Dress Antique Collecting Apocalypse Preparation Backgammon Strategies Best Dating Sites Biker Dating BioHacking Blackjack Strategies Casino Bonus Offers | Changing Bad Habits Children Of Divorce Cigars Funeral Insurance Gold Mining Methods Homesteading Marine Supplies Public Speaking Slots Machine Strategies Solar Power Tattoo Supplies Witchcraft Lawn Mowing Dallas Handyman Services Houston Power Washing Seattle Window Cleaning Phoenix Lawn Cleanup Chicago Roof Repair Detroit Fence Repair Baltimore Appliance Repair Miami Home Cleaning San Francisco Gutter Cleaning Nashville Plumbing Services Austin Lice Removal Greensboro Drug Rehab Denver Essay Editing Electrical Oklahoma City led tube lights Bobbleheads garden incinerator pet supplies Nappies led lights dog bowls Sweater face masks with over the head straps RC Helicopter Halloween masks |
.
This is my new keyword set for algorithm changes and was built to get a wide range of markets, local, ecomm, national, etc etc.
I would have done 100, but that deep into Excel hell was enough for me.

So, the next step was to correlate each of the different categories that the API broke the data down into and see if there was a ranking factor.
In order to do that I used Hexomatic to pull the top 100 ranking URLs for each of the keywords above. (if you want those sheets just hit me up, pretty sure the account saves them for a while to download again).
Then I used the List function in Screaming Frog and imported those URLs at which time the software ran through them and gathered the API data.
Now, user beware, if you export from the button on the PageSpeed tab in Screaming Frog, you lose your sort order. So they are no longer there by ranking position.
You have to do the full export with the export button up top to get the URLs back in the order that you put them in, in my case, ranking 1 through 100.
From there, it’s time to put your Business Intelligence data scientist hat on (stab yourself in the face and hide the kittens to prevent kicking) and do the correlations.
Or you can just fire up Ted’s Correlate Anything software and do it the easy way.
I did that. The cat was happy.
Let’s see what we learned.

Results:
Where possible, I provided the Google definition of what the measurement is.
Obviously, Google didn’t make that easy so if I don’t have it, it’s anybody’s guess what they are really looking for to make these fancy numbers.
Also, I didn’t do everyone, clearly, some were based on others in the list and it seemed redundant. But I covered the ones everyone says were the factor and a few that I was interested in.
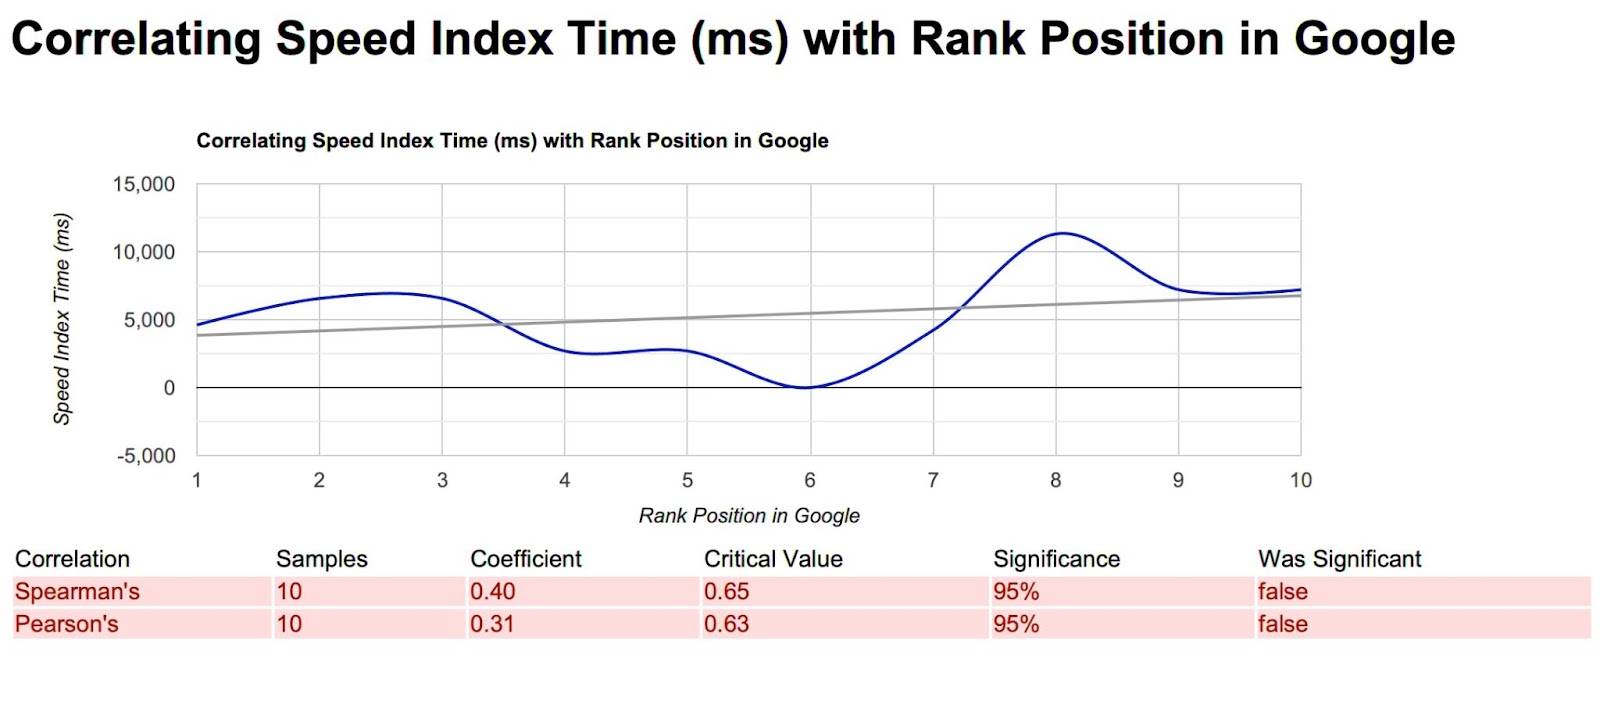
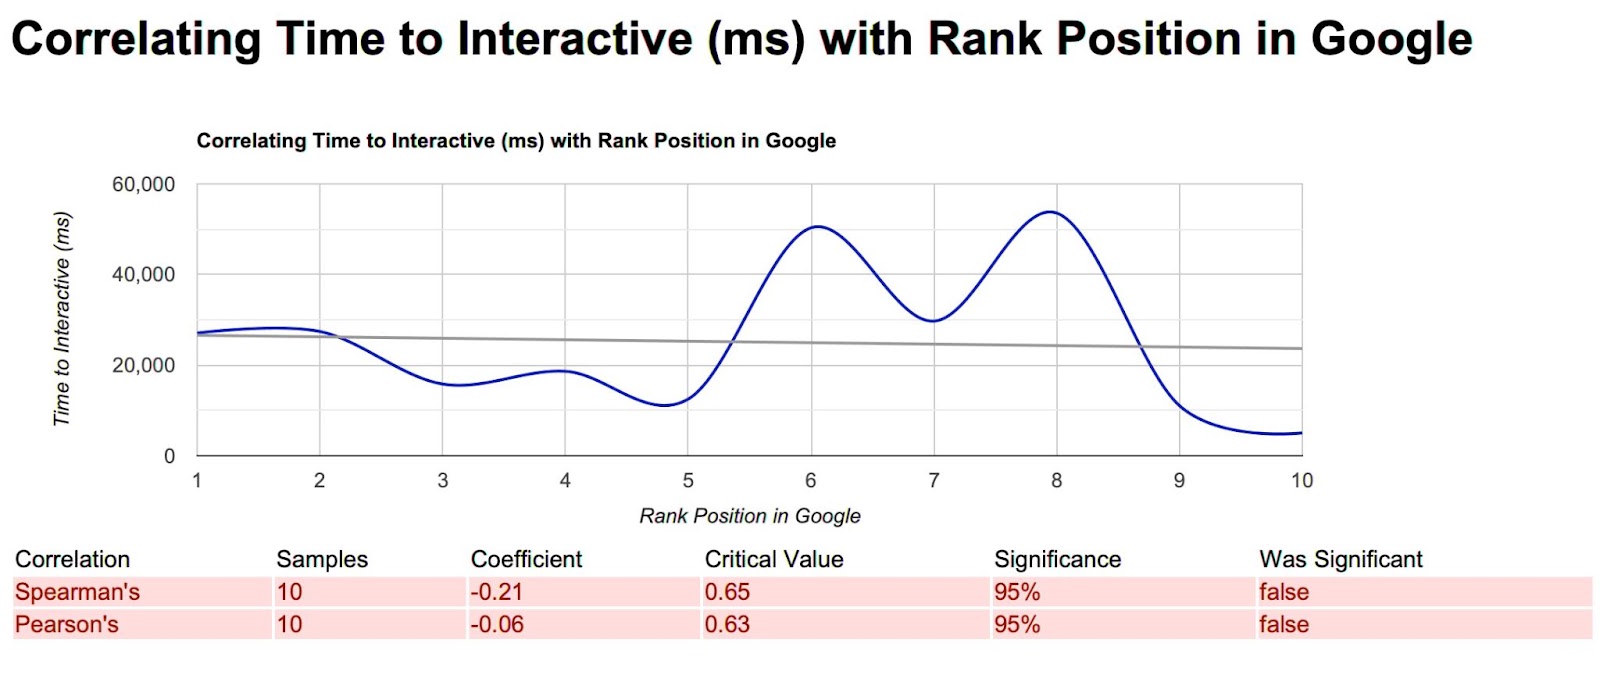
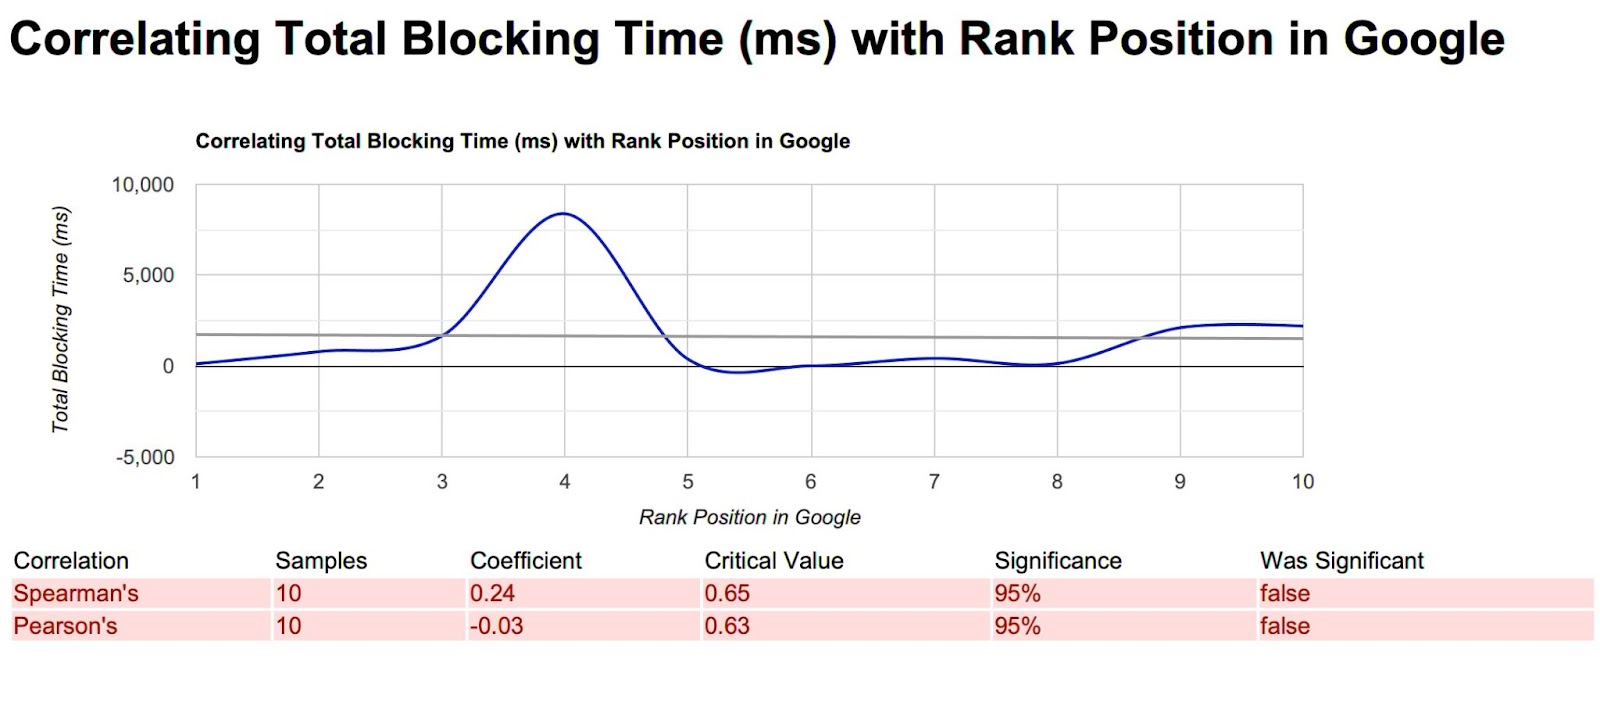
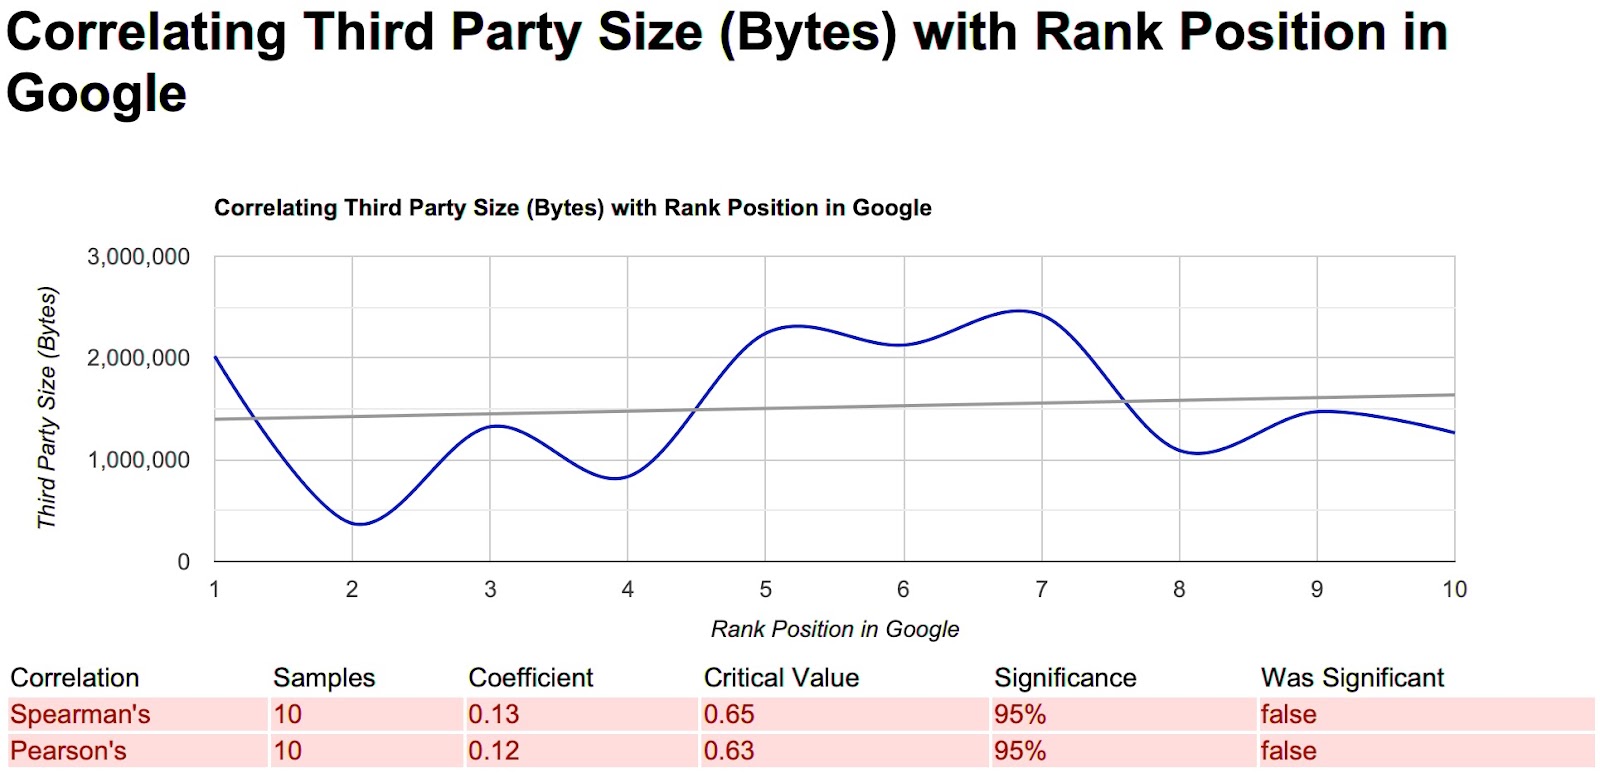
Unless otherwise noted, the first image is a specific keyword and its top ten results.
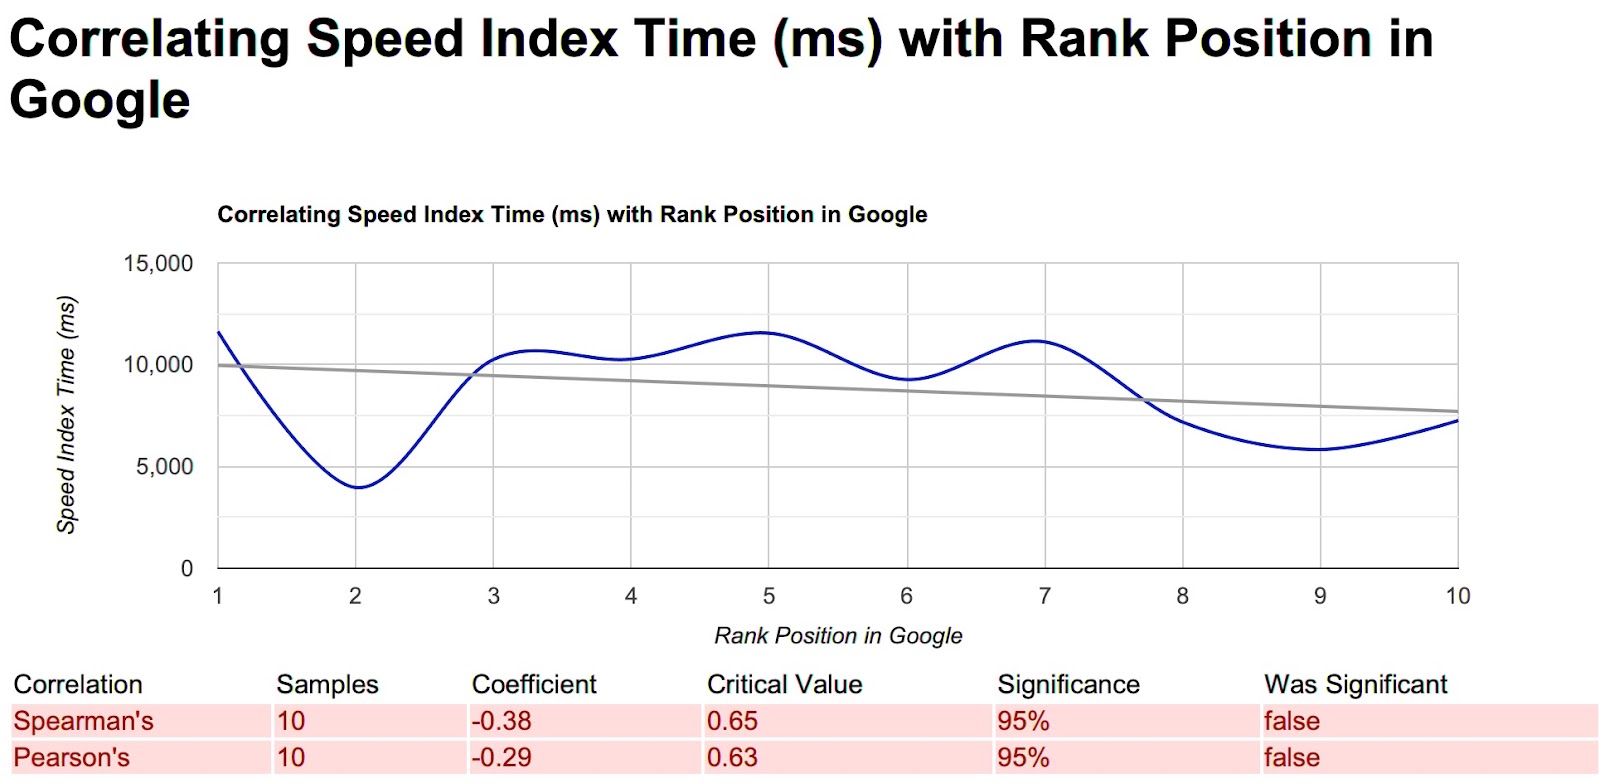
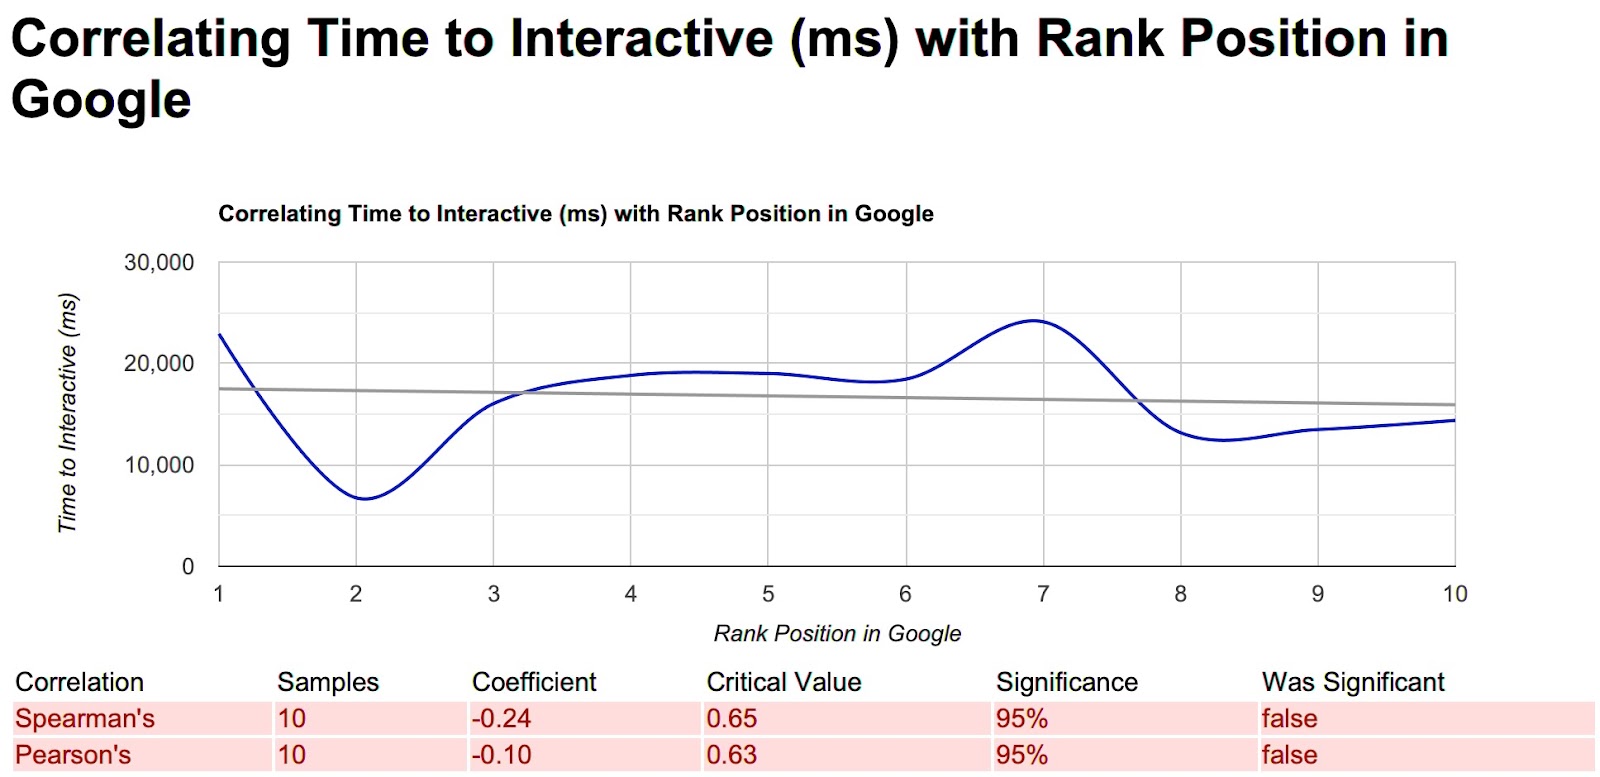
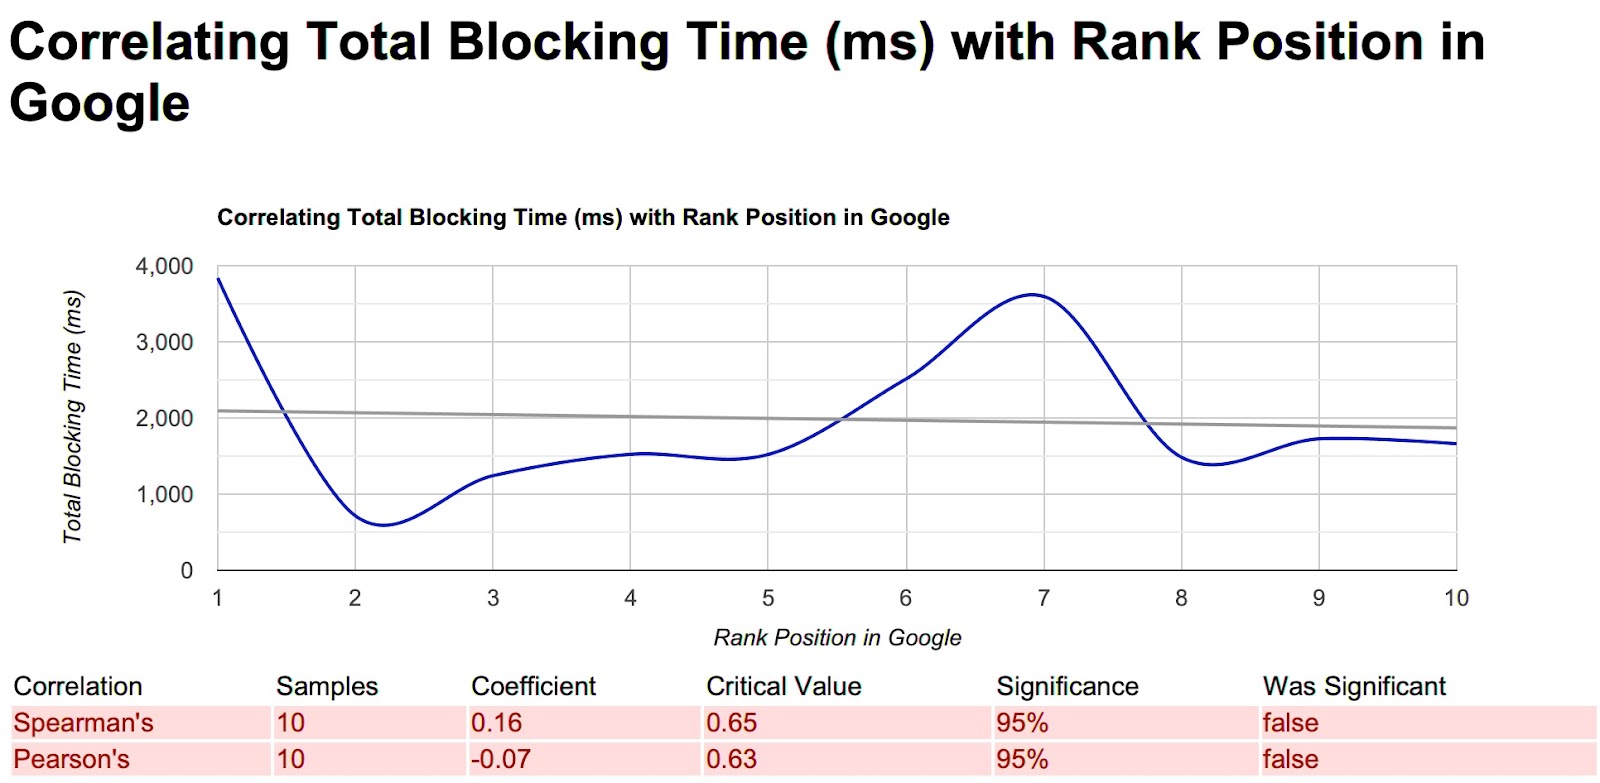
The second image is all 76 keywords top then scores averaged then put into a chart to highlight variation. If a thing is a factor in the algo, then the straighter the line.
Variation in quality scores for rankings brings us right back to our favorite find.
The tools are running random math.
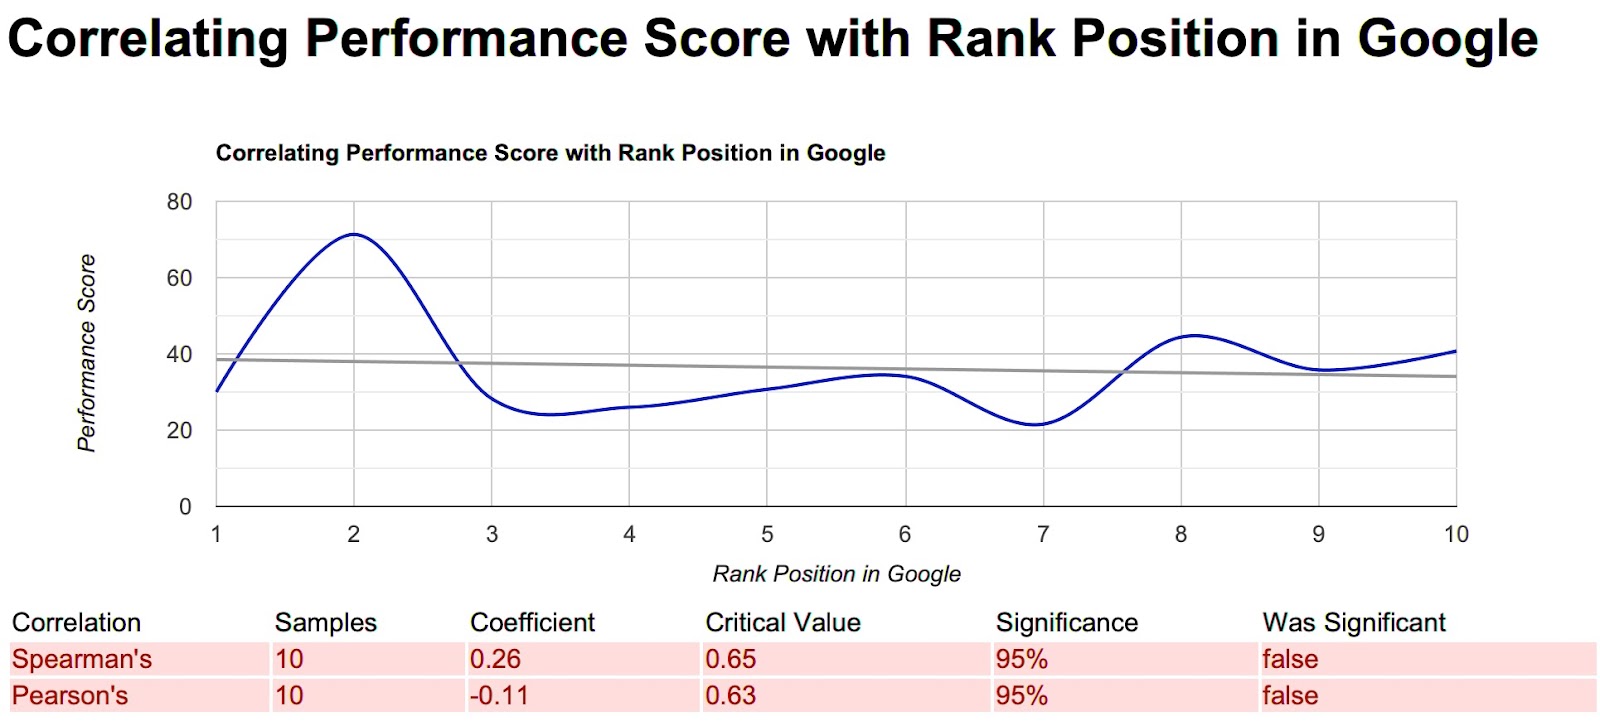
Performance Score – Not a factor
A Page Performance Score is a single metric that considers all of the important user experience metrics in Core Web Vitals. This score uses an aggregate scoring system across all mobile and desktop visits. It takes the weighted average to deliver a single score to understand pages that need closer examination quickly.

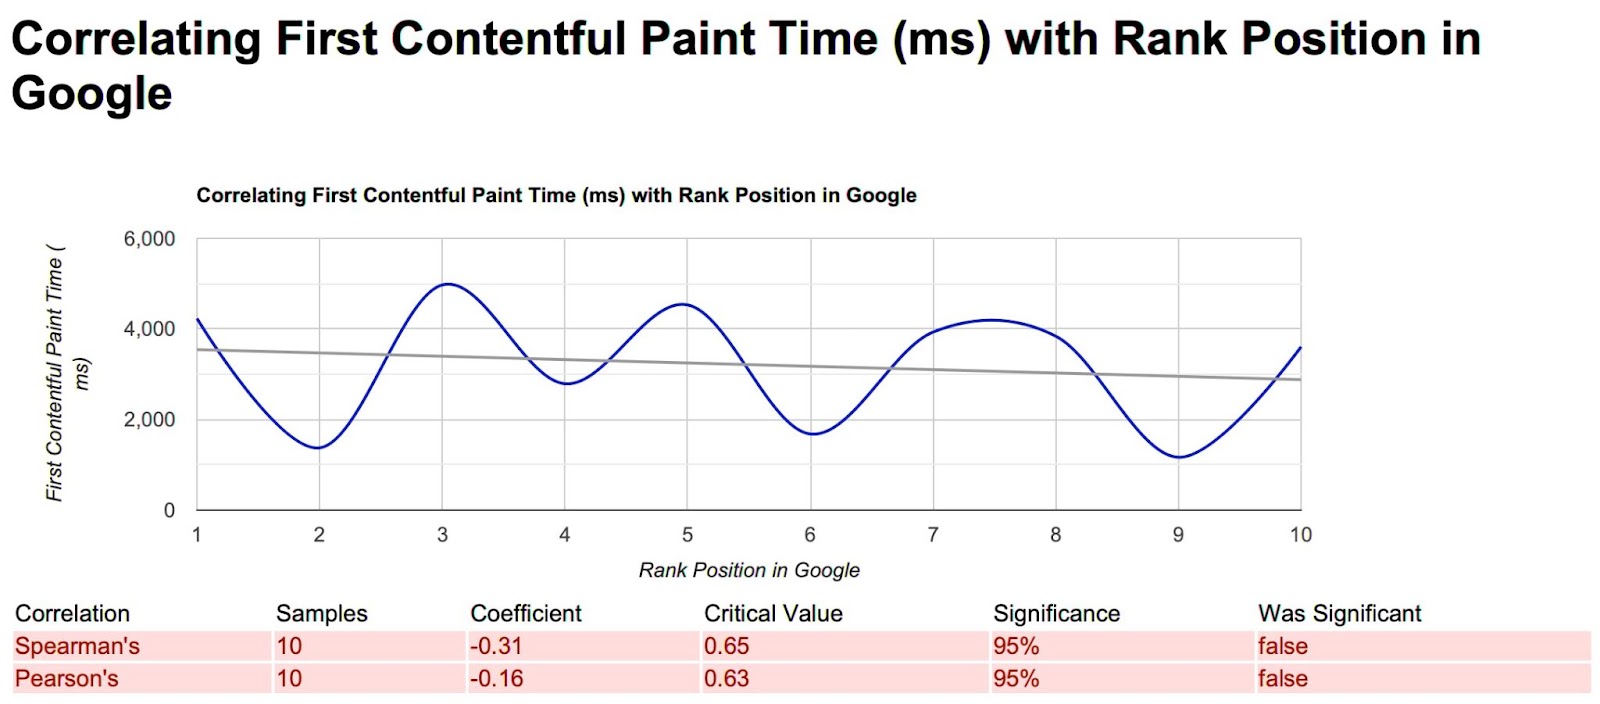
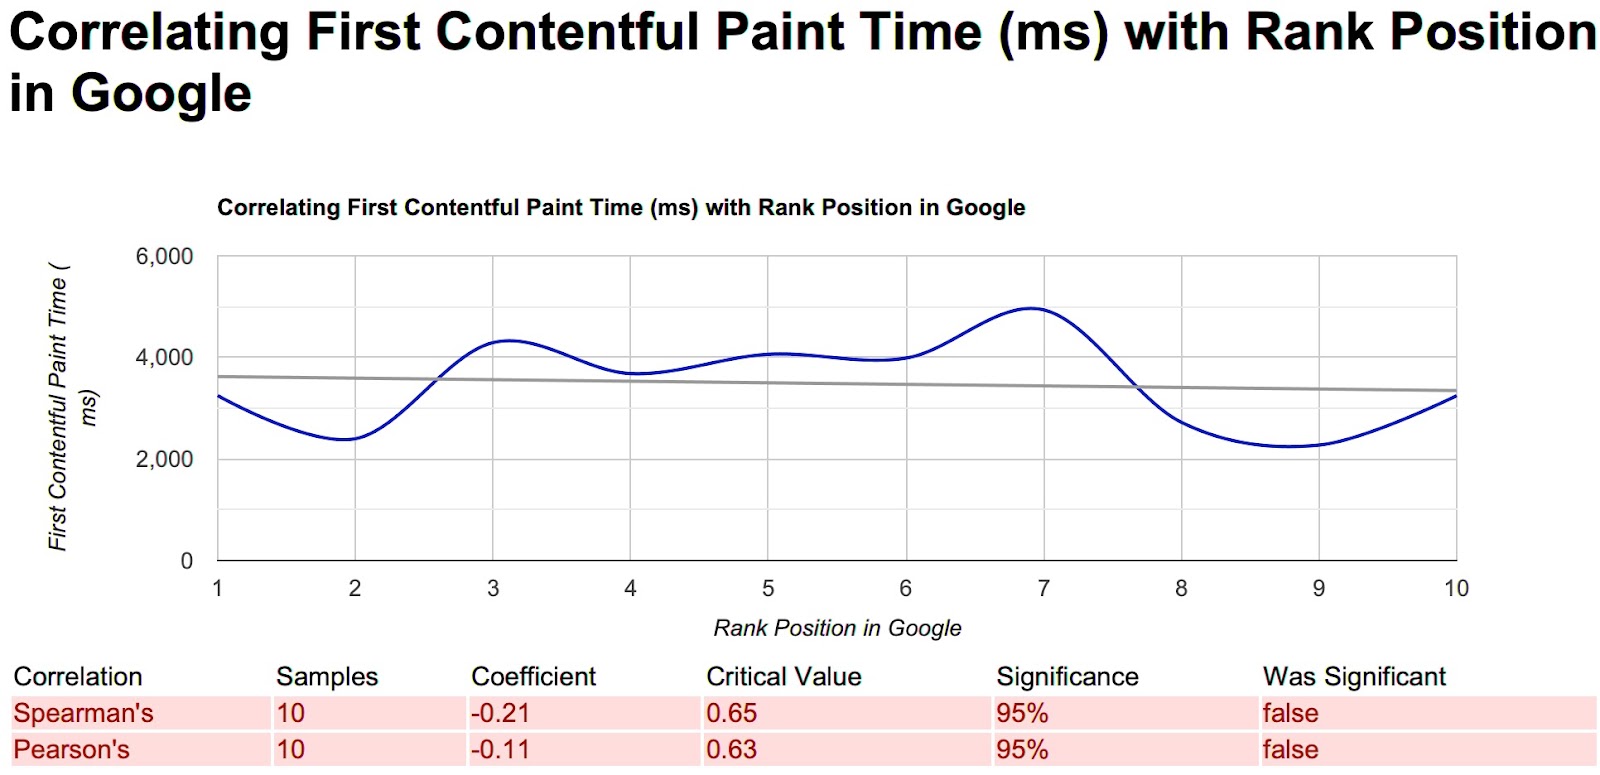
First Contentful Paint Time (ms) – Not A Factor
First Contentful Paint (FCP) is a non-Core Web Vital that measures the time from when a page starts loading to when any part of that page’s content is rendered on the screen. … Within this context, content means text, images (including background images), <svg> elements, and non-white <canvas> elements.
Speed Index Time (ms) – Not A Factor
Speed Index measures how quickly content is visually displayed during page load. Lighthouse first captures a video of the page loading in the browser and computes the visual progression between frames. Lighthouse then uses the Speedline Node.js module to generate the Speed Index score.
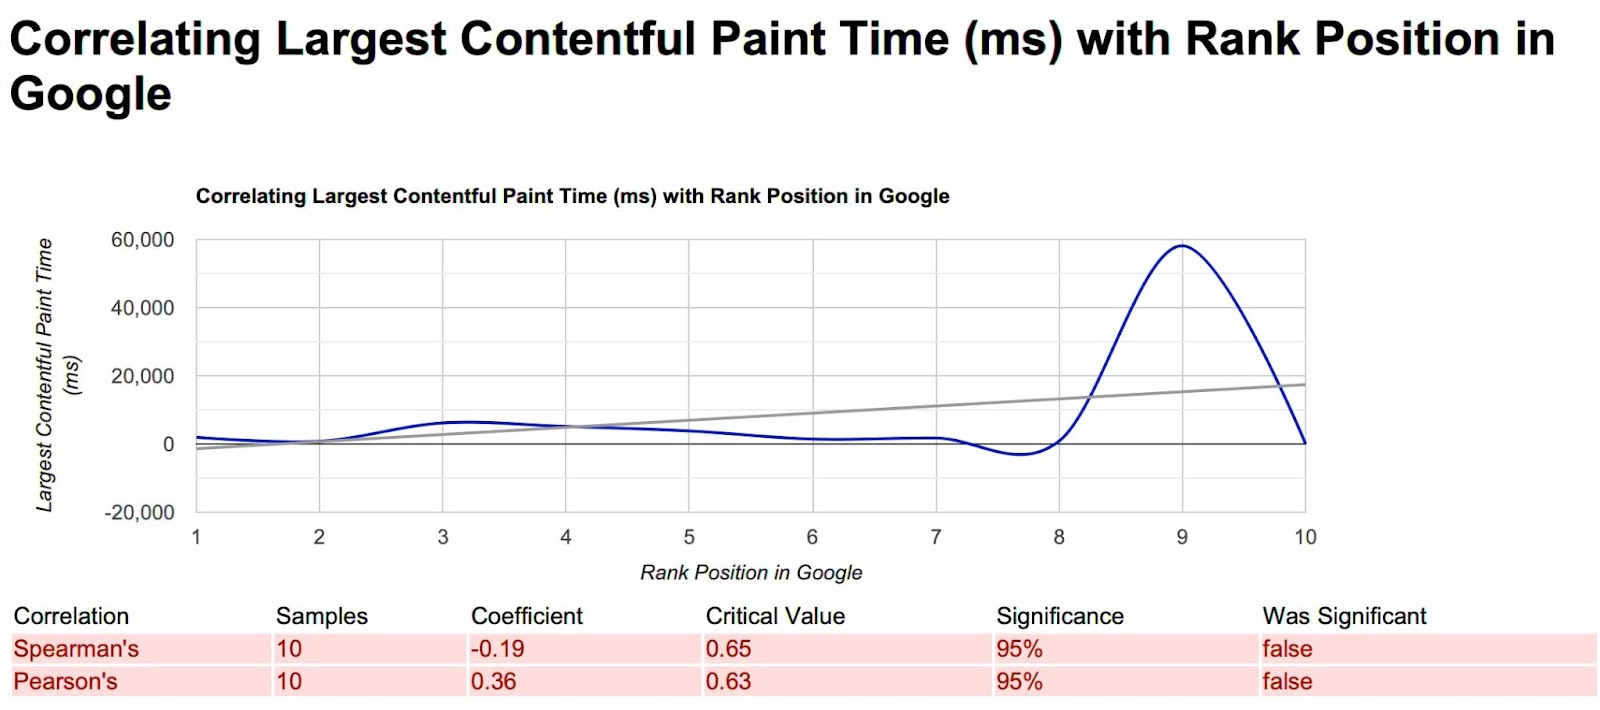
Largest Contentful Paint Time (ms) – Not A Factor
Largest Contentful Paint is the metric that measures the time a website takes to show the user the largest content on the screen, complete and ready for interaction. Google defines that this metric considers only the content above the page’s fold, meaning everything that appears without scrolling.

Time to Interactive (ms) – Not A Factor
TTI measures how long it takes a page to become fully interactive. A page is considered fully interactive when:
- The page displays useful content, which is measured by the First Contentful Paint,
- event handlers are registered for most visible page elements,
- and the page responds to user interactions within 50 milliseconds.
Total Blocking Time (ms) – Not A Factor
The Total Blocking Time (TBT) metric measures the total amount of time between First Contentful Paint (FCP) and Time to Interactive (TTI) where the main thread was blocked for long enough to prevent input responsiveness.
The main thread is considered “blocked” any time there’s a Long Task—a task that runs on the main thread for more than 50 milliseconds (ms). We say the main thread is “blocked” because the browser cannot interrupt a task that’s in progress. So in the event that a user does interact with the page in the middle of a long task, the browser must wait for the task to finish before it can respond.
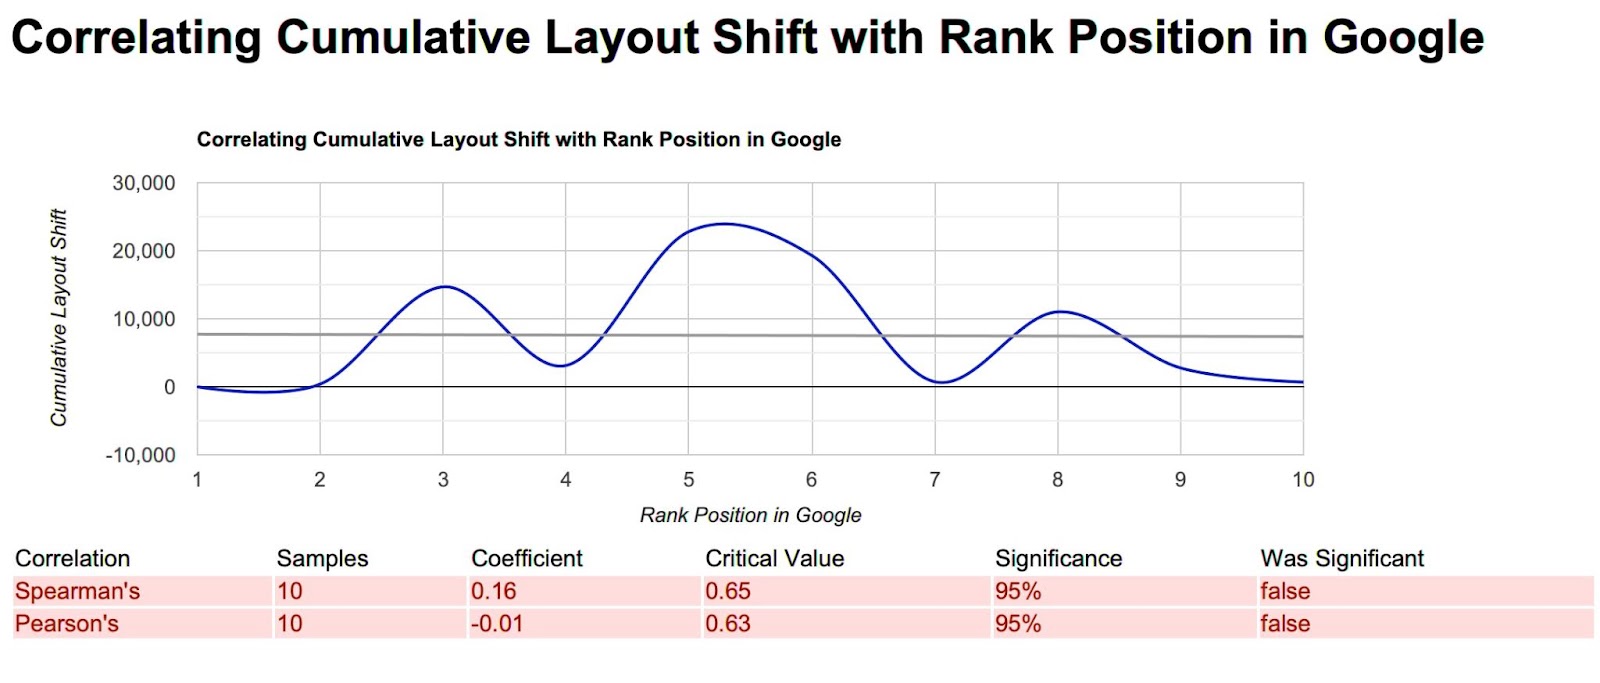
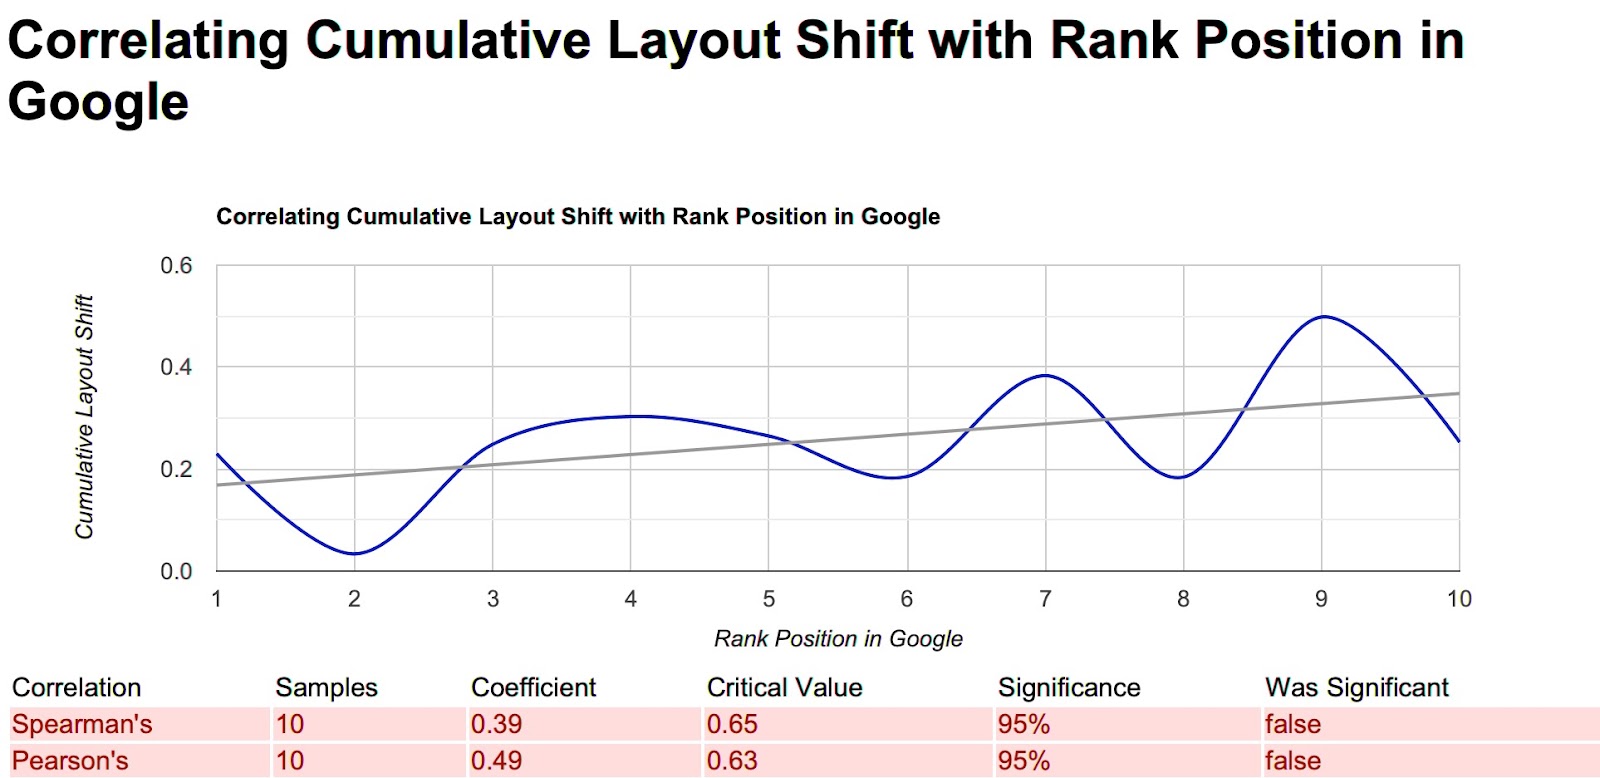
Cumulative Layout Shift – Not A Factor
CLS is a measure of the largest burst of layout shift scores for every unexpected layout shift that occurs during the entire lifespan of a page.
A layout shift occurs any time a visible element changes its position from one rendered frame to the next. (See below for details on how individual layout shift scores are calculated.)
Total Requests – Not A Factor
No official definition for the API, however, a request is:
A web request is a communicative message that is transmitted between the client, or web browsers, to the servers. … A web request can also be known as an HTTP request which is the protocol that interacts between the client and the server. A client will type in a URL address prompting the web request to the server.


Total Page Size (Bytes) – Not A Factor
How big your website is measured in bytes. From what I can tell it’s HTML, CSS, JS, and all that combined.

Image Size (Bytes) – Not A Factor
This is all the bytes for all your images added up.
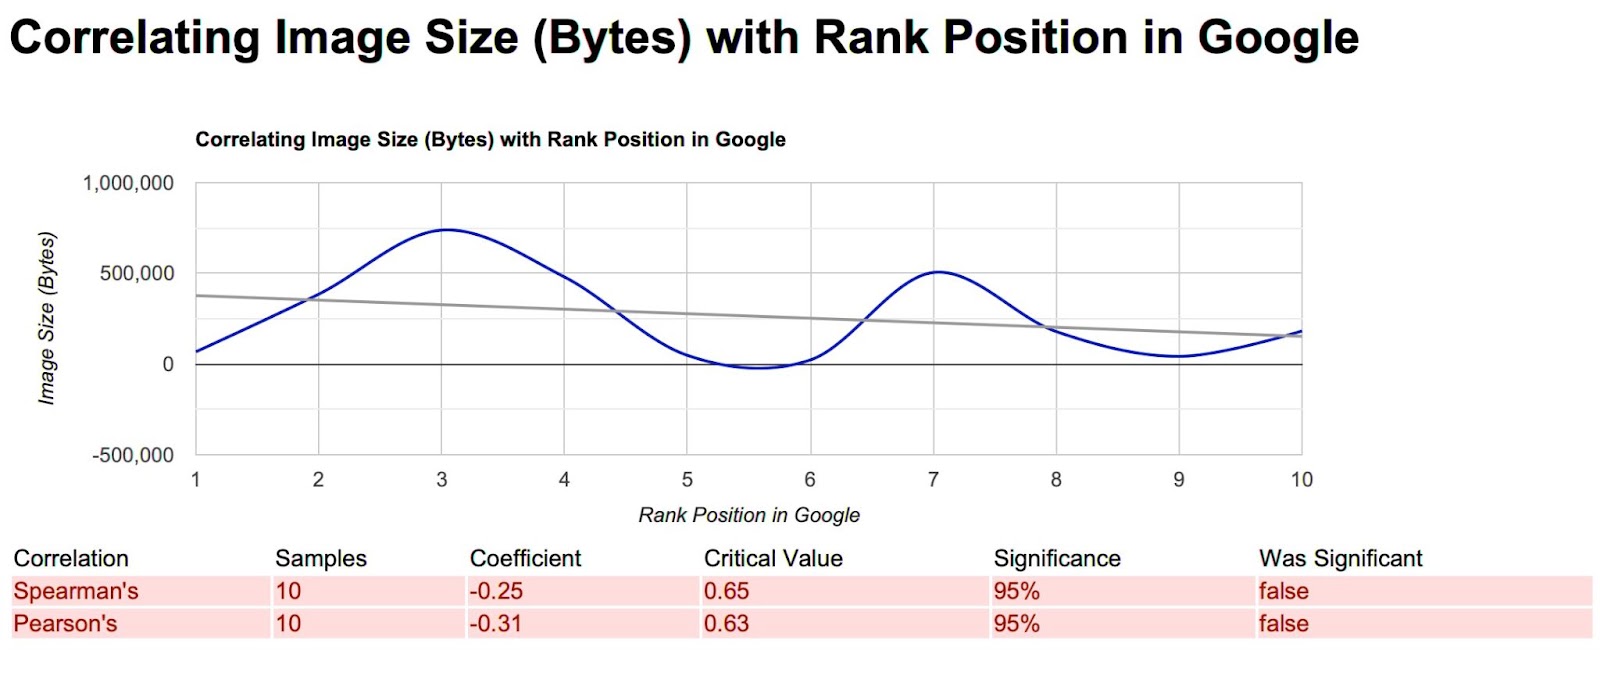

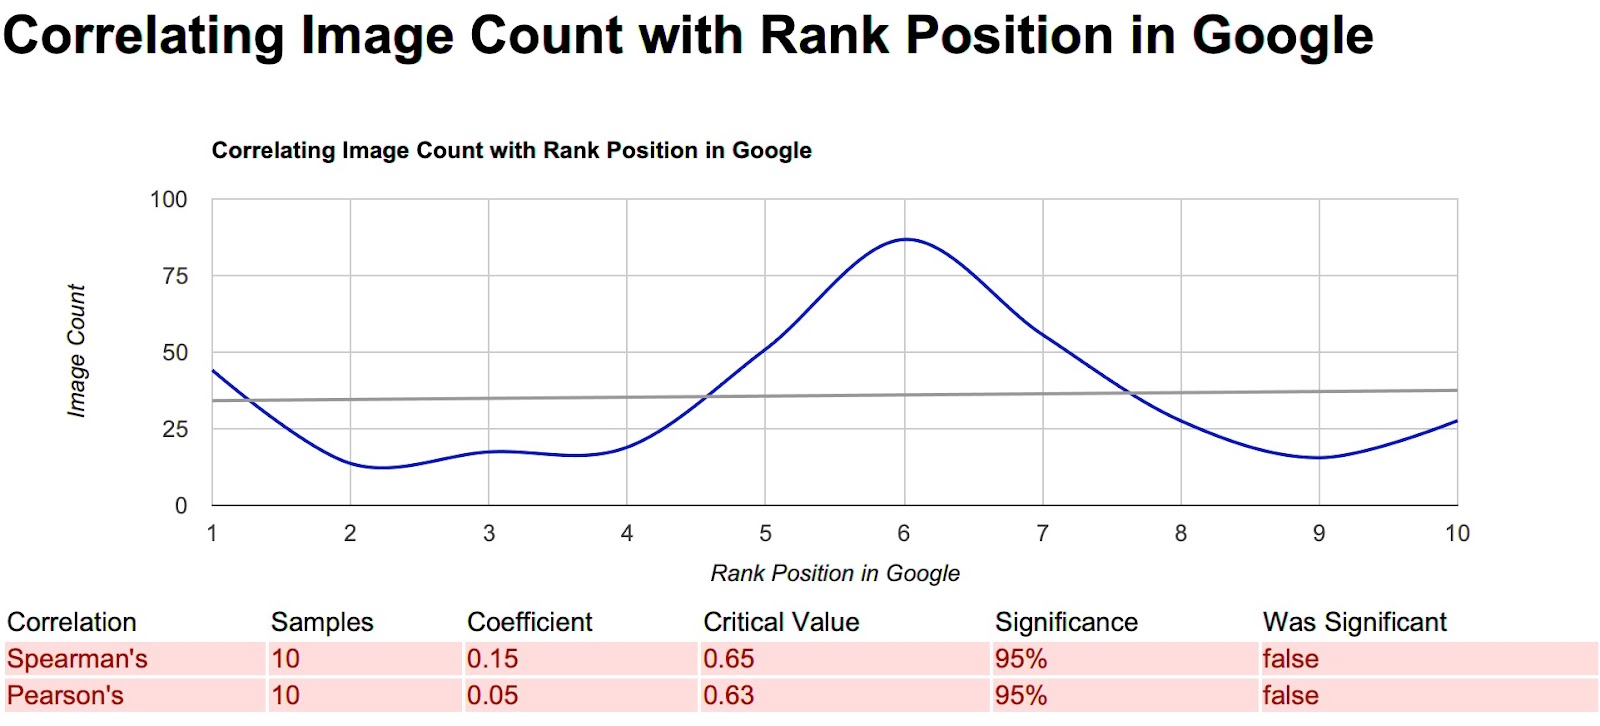
Image Count – Not A Factor
How many images that you have on your site. This includes all your design graphics, logos, etc, etc.

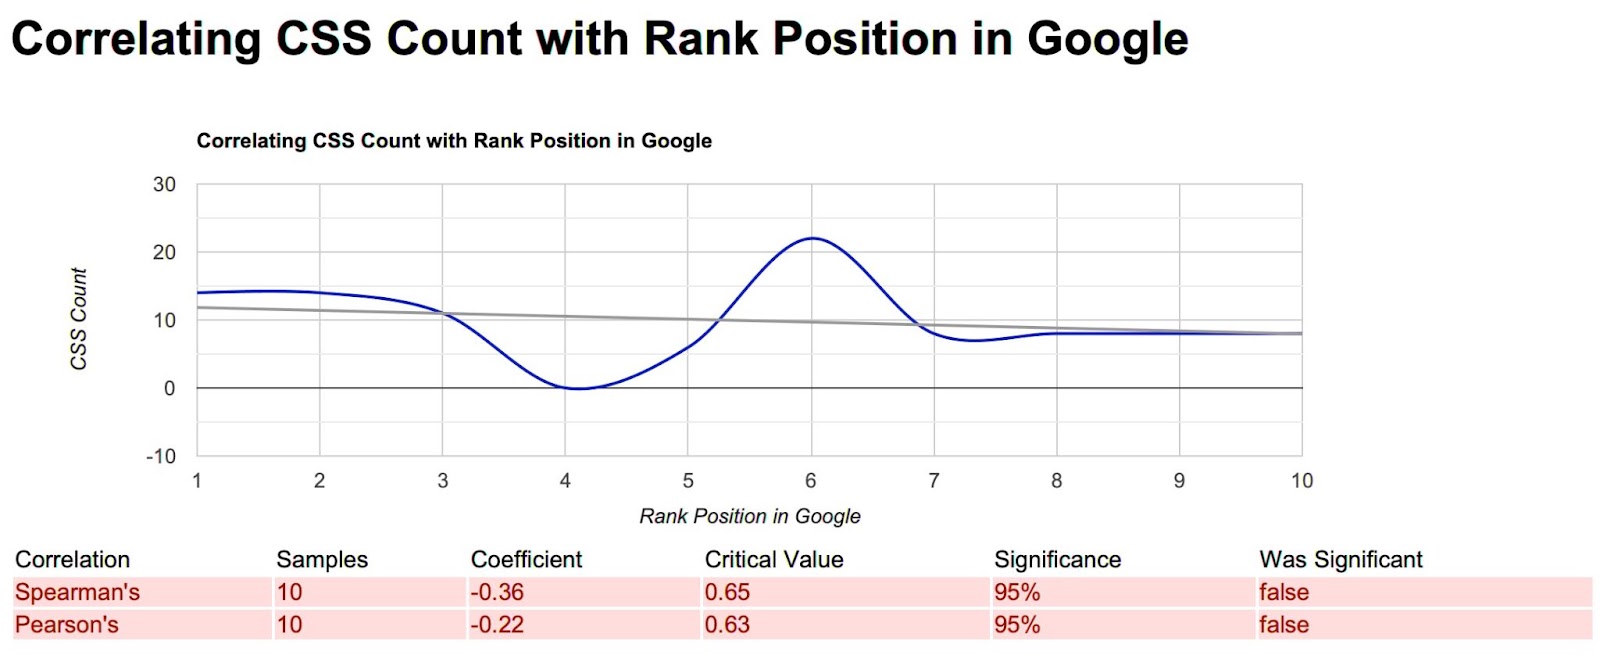
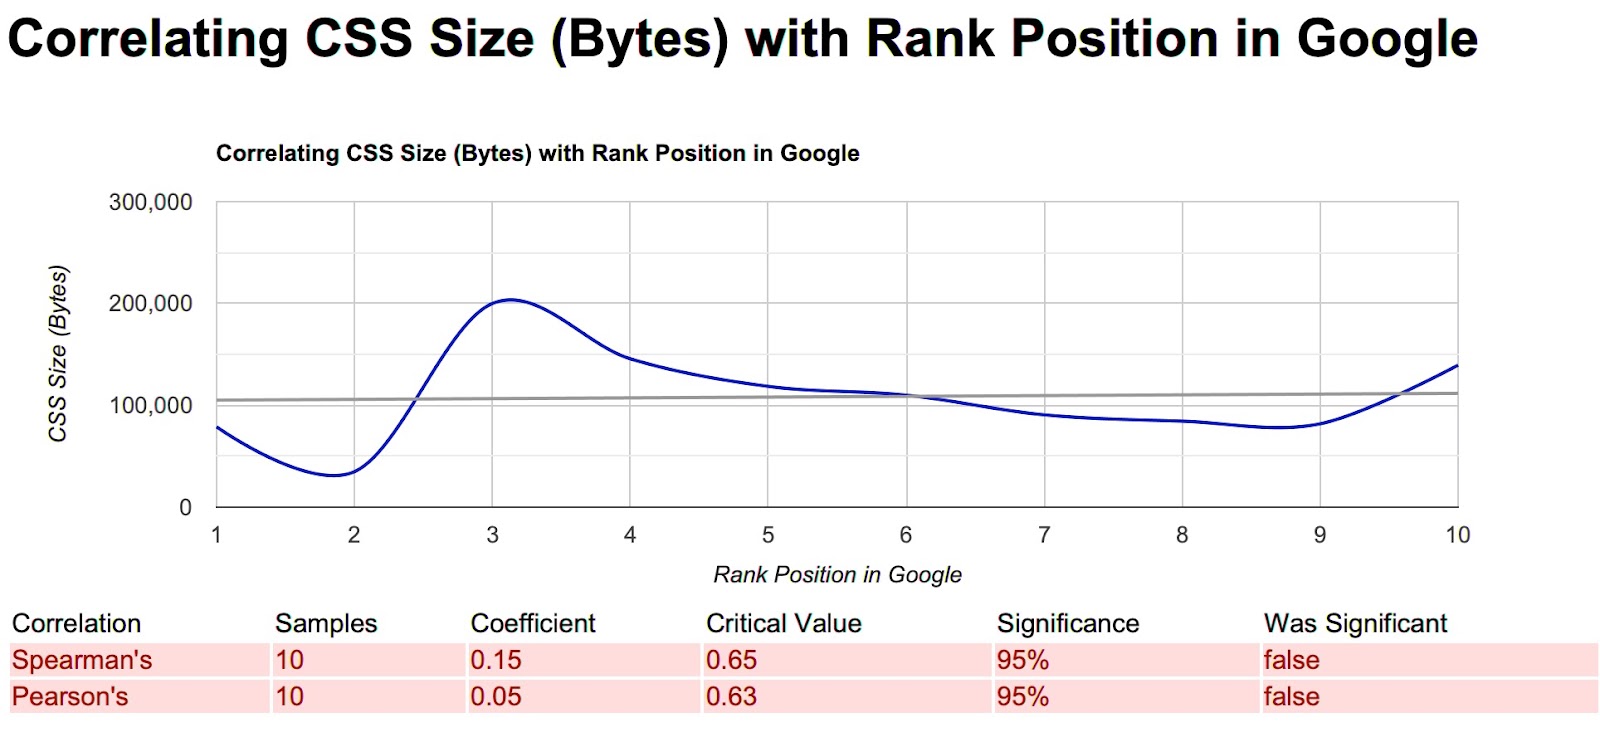
CSS Count – Not A Factor – But size does correlate with rankings more often than not.
No information was provided, assuming that it’s counting the number of CSS elements on the page or referenced on the page. Minify and Combine CSS anyone?

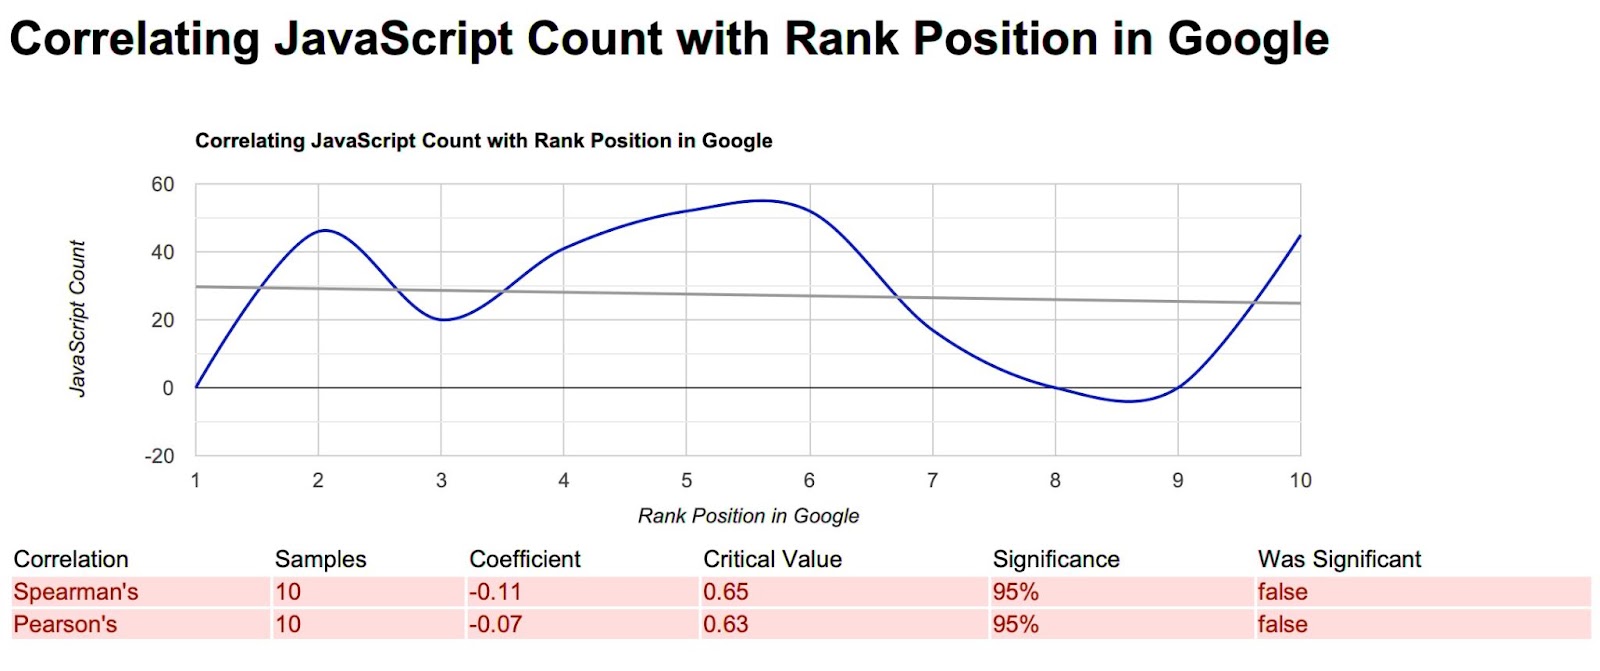
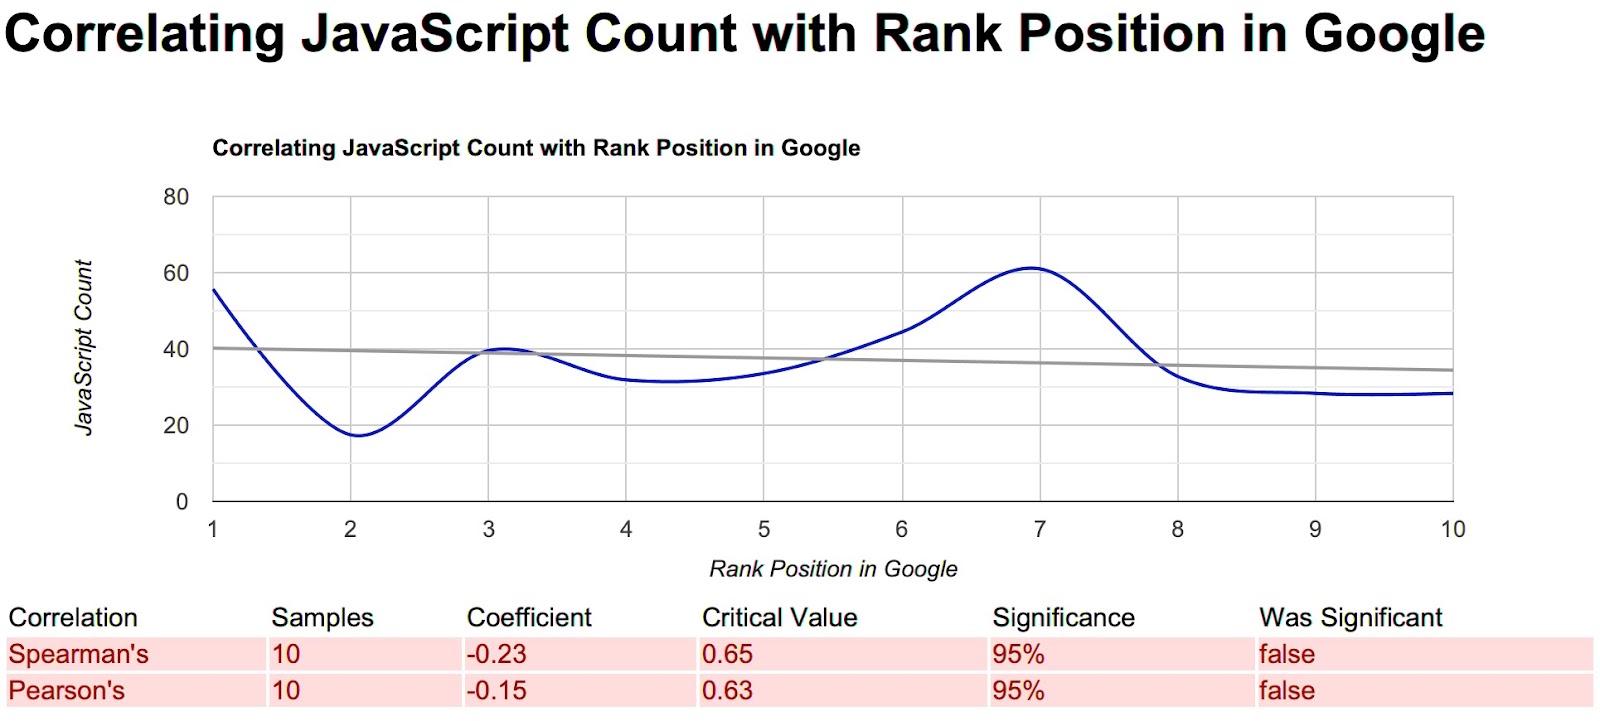
JavaScript Count – Not A Factor – But size does correlate with rankings more often than not.
No information was provided, assuming that it’s counting the number of Javascript elements on the page or referenced on the page. Minify and Combine JS anyone?

Font Count and Font Size (Bytes) – Count correlates really closely in the top ten for these ten keywords, but size doesn’t matter.
The combined size of the files that drive your fonts.


Media Size – Not A Factor
No official definition was given, but since images are counted separately we’ll assume they are talking about all those videos and audio files we love to put in our hero’s.
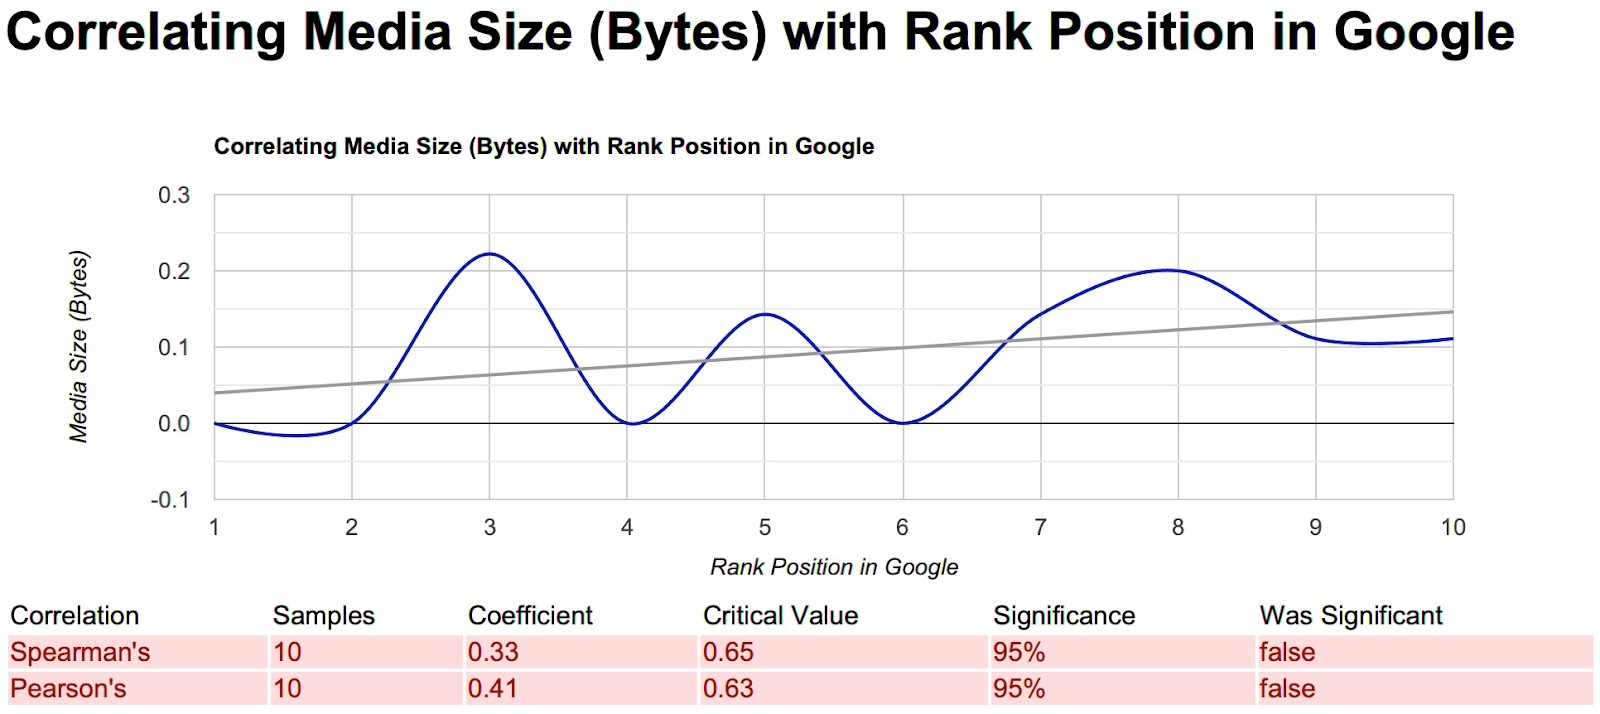
Other Size (Bytes) – Loosely correlates with rankings in the top 10
No explanation was given, assume it’s everything else that we add that doesn’t fall into another category.

Other Count – Not a Factor
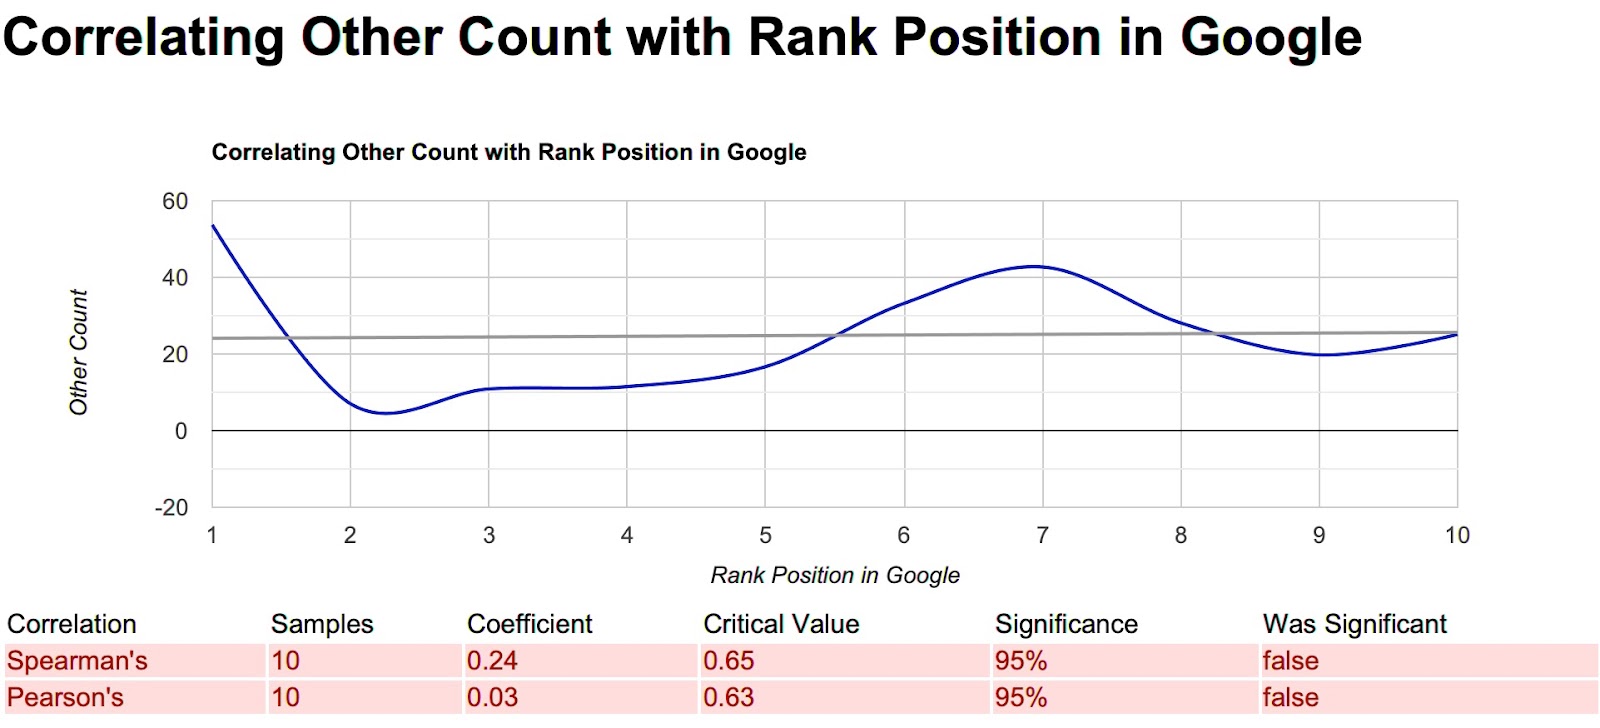
Third-Party Count – Not A Factor
All those third-party things we like to add to retarget, chat, maps, and video everyone to death.
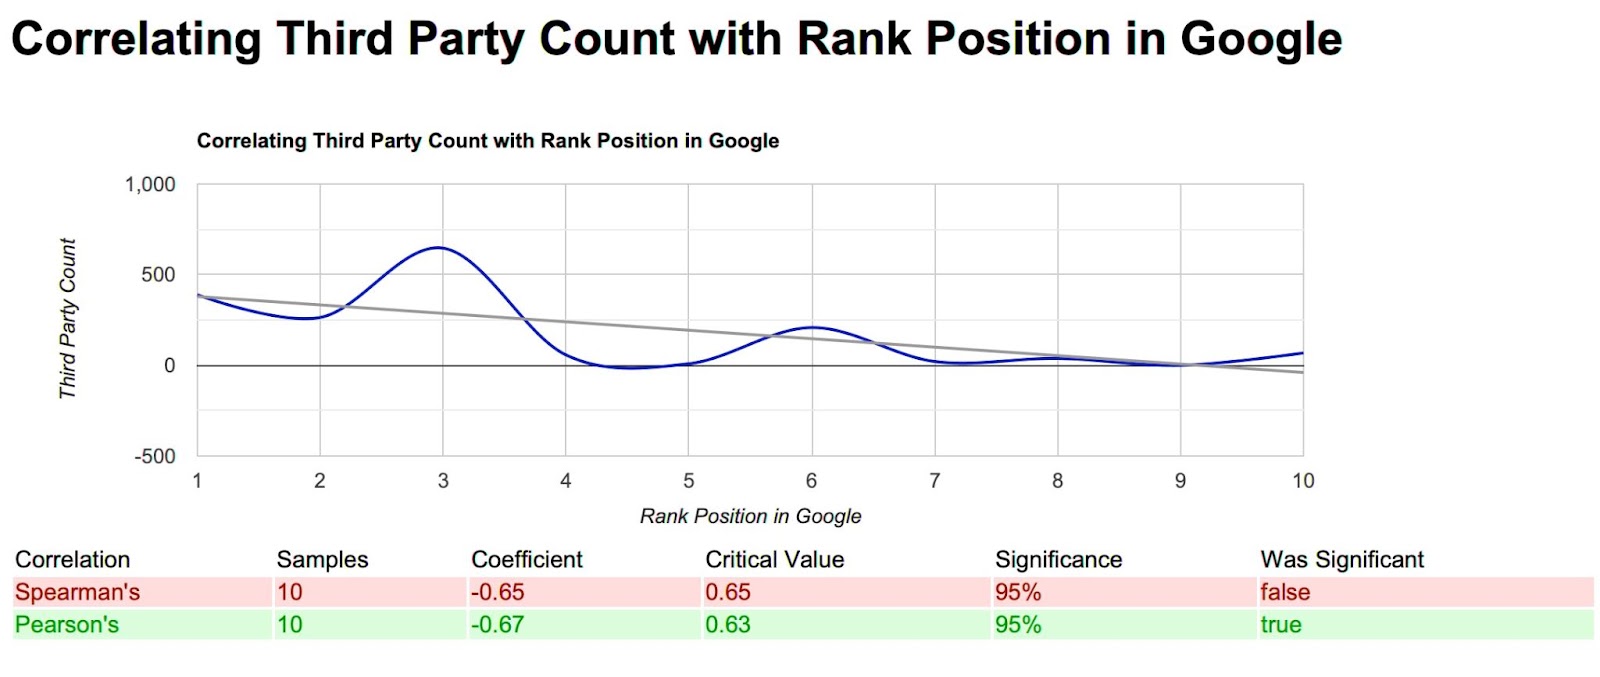
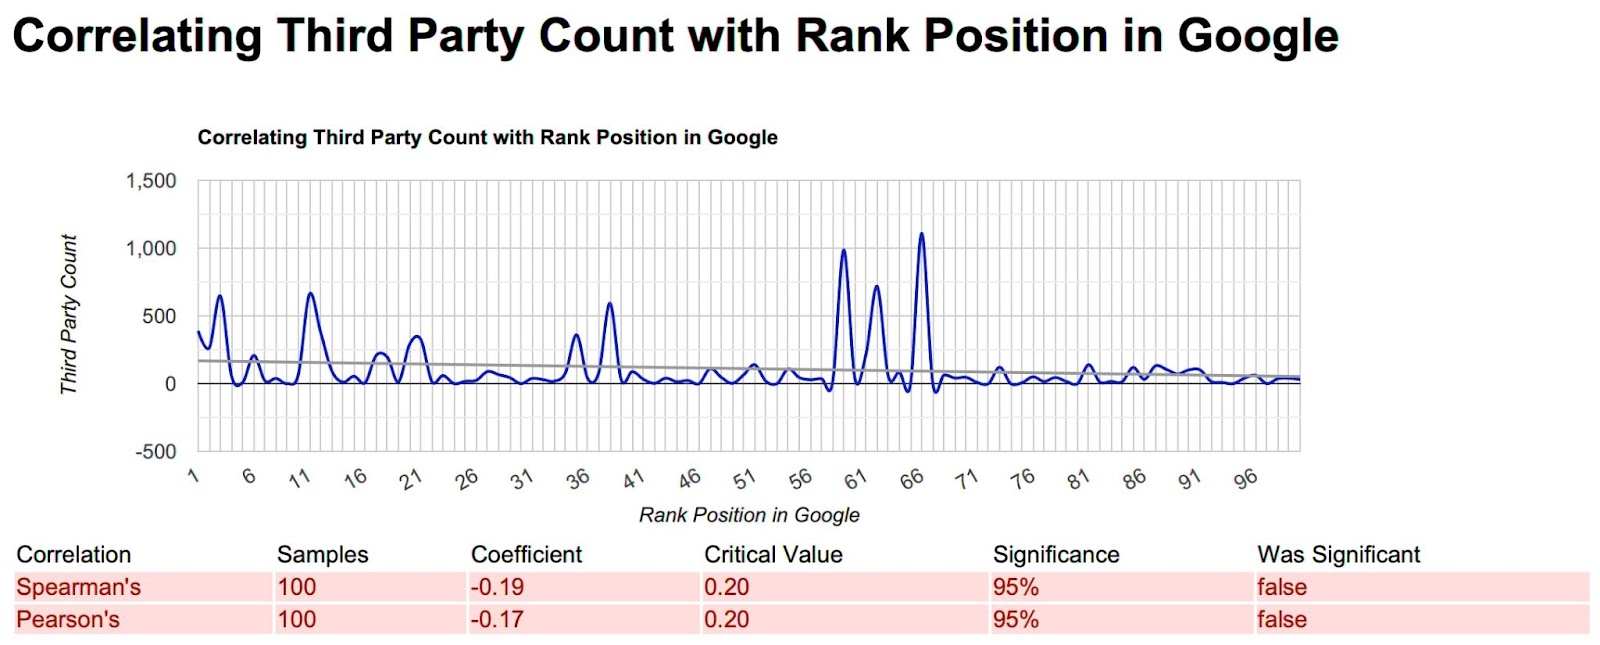

Third-Party Size (Bytes) – Not A Factor
Core Web Vitals Assessment
This one is the best, and if it doesn’t kill the CWV is a ranking factor hype I don’t know what does.
The API literally returns a Pass or Fail rating for Core Web Vitals.
I mean, you pretty much can’t get more cut and dry about Pass or Fail right.
It’s SO important to Google that you pass CWV tests that less than 1/3rd of the URLs get a pass or fail grade from the API.
LESS THAN A THIRD.
1 is Pass, 2 is Fail, 3 is Google doesn’t care enough about you to grade you.
So yeah, passing or failing, not a factor.
So to Core Web Vitals, I say

But wait, there’s more.
Remember that poll from SEO Signals Lab where I asked if CWV’s was a ranking factor?
Well, in the comments of said poll, people cited user experience as the ranking factor. Specifically, Google was combining all the user experience metrics like bounce rate, time on page, etc etc and that’s how CWVs impacts sites.
First, all those individual things were tested by SIA, and guess what, individually they are not factors. Now, full disclosure, we need to test those again, things change around here after all.
But Google did us one better.
Enter CrUX
Chrome User Experience Report
These are factors Google says involve CrUX
Important metrics to measure #
- First contentful paint (FCP): measures the time from when the page starts loading to when any part of the page’s content is rendered on the screen. (lab, field)
- Largest contentful paint (LCP): measures the time from when the page starts loading to when the largest text block or image element is rendered on the screen. (lab, field)
- First input delay (FID): measures the time from when a user first interacts with your site (i.e. when they click a link, tap a button, or use a custom, JavaScript-powered control) to the time when the browser is actually able to respond to that interaction. (field)
- Time to Interactive (TTI): measures the time from when the page starts loading to when it’s visually rendered, its initial scripts (if any) have loaded, and it’s capable of reliably responding to user input quickly. (lab)
- Total blocking time (TBT): measures the total amount of time between FCP and TTI where the main thread was blocked for long enough to prevent input responsiveness. (lab)
- Cumulative layout shift (CLS): measures the cumulative score of all unexpected layout shifts that occur between when the page starts loading and when its lifecycle state changes to hidden. (lab, field)
From our data, we know that NONE of those are ranking factors.
But the API does us one better.
They give us the data that they are measuring as part of CrUX, so let’s see how those stack up. After all, those user experience folks may be right.

nope
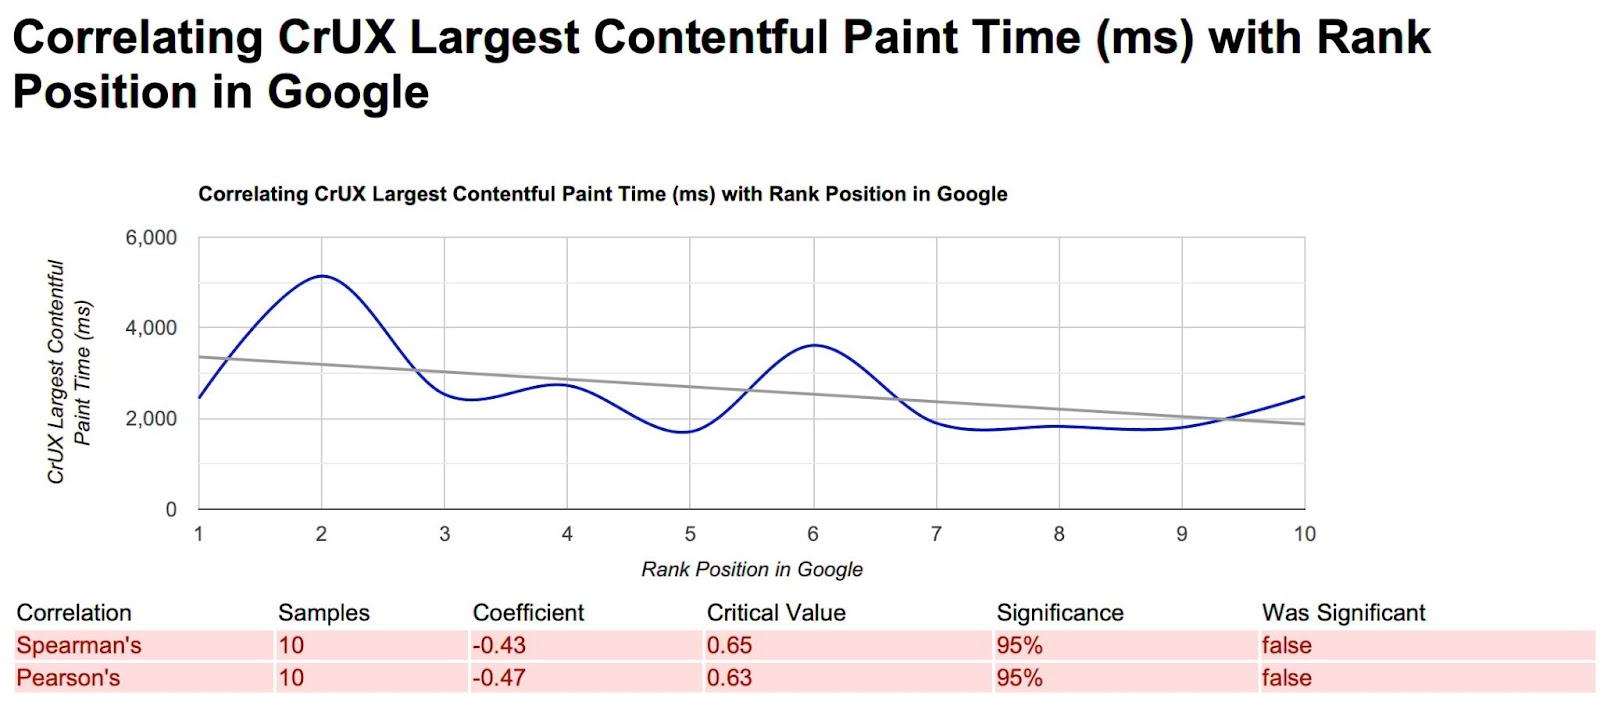
nope

maybe, IF Google had given us all the numbers for all the URLs, 80% of them are blank.
Google cares so much about CrUX (aka user experience) that they don’t keep data for most URLs.


Nope, nope, nope.
With all the blank data in all the top 100 reports, there is NO WAY we can say CrUX is a ranking factor.
We can assume by the lack of saved data, Google couldn’t give a…

Surely I didn’t look through 76 spreadsheets of the top 100 and not find a single darn thing that correlated with rankings.
Surely Google didn’t tease this thing to be a ranking factor and not put one single thing in as a measurable, visible, correlating factor.
Well, you’d be right.
They actually did give us some real clues as to what they actually care about.
Because in all this core web vitals data.
Because in all this CrUX data
Because in all this Lighthouse data
Because in all this PageSpeed API data, we learned that….

Remember when we looked at CSS size and Javascript Size?
Well those correlated right, those were our first two clues.
Then we got this one:
HTML Size (Bytes) –
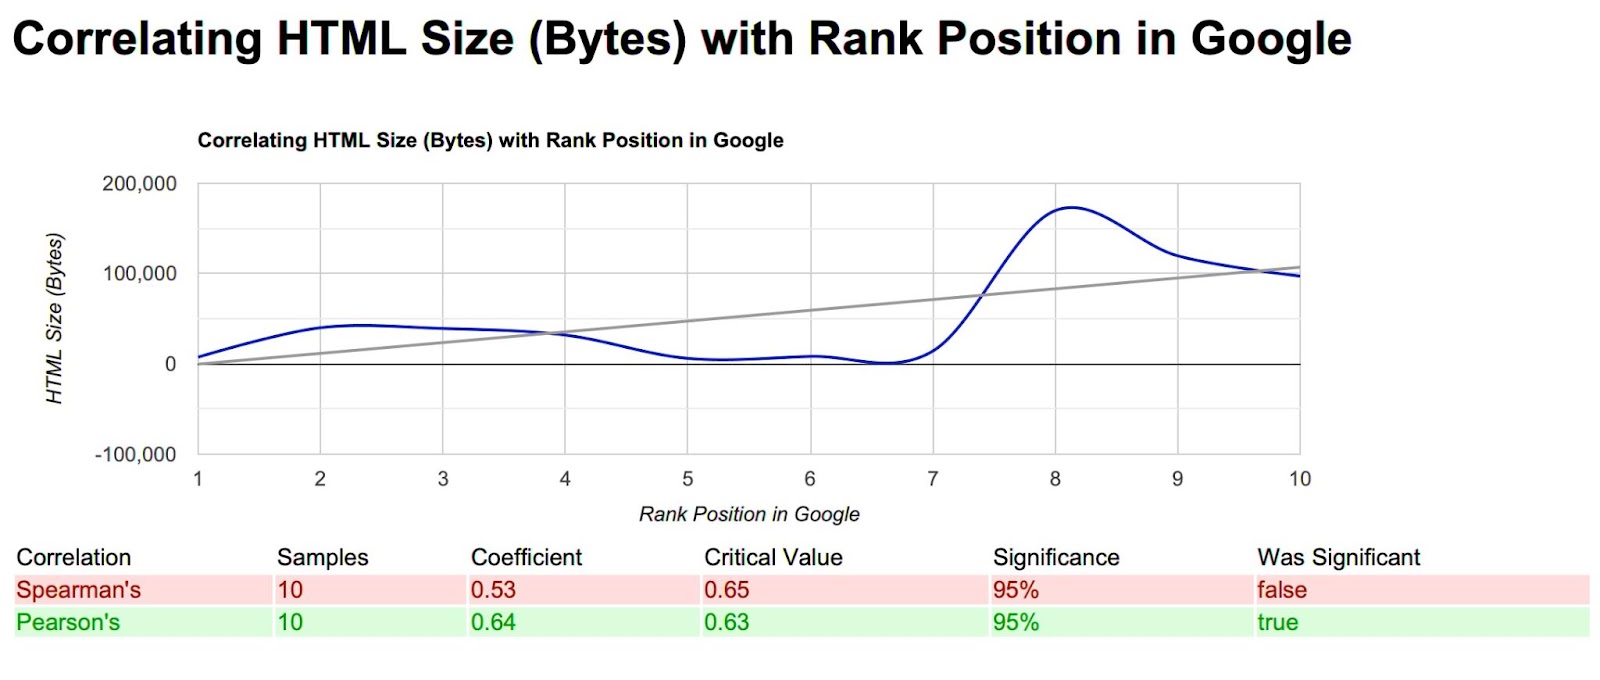
Smaller HTML size correlates with top 5 rankings in the search results.
But let’s look at the top 100
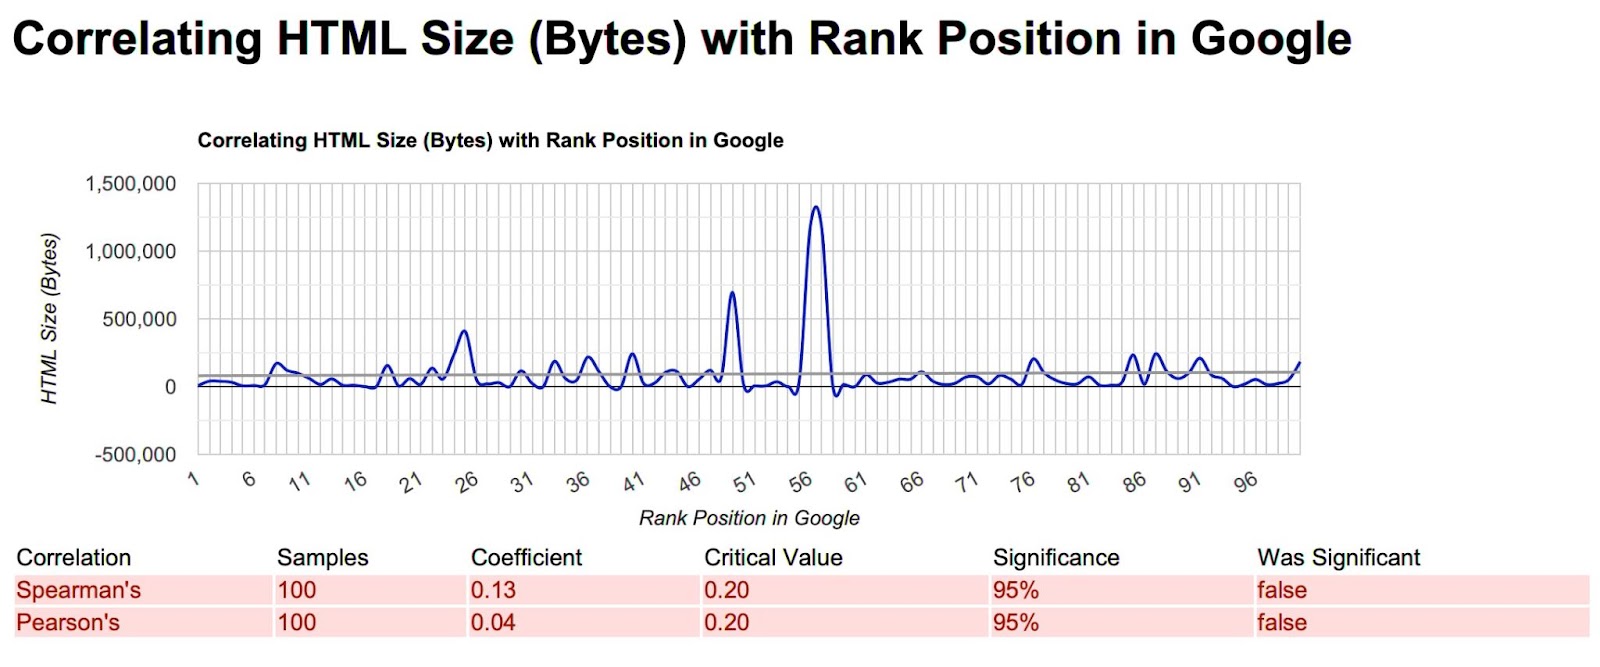
Because of the outliers and some URLs the API doesn’t bother reporting (Wikipedia and Google properties mainly), the software doesn’t see it, but it’s there.
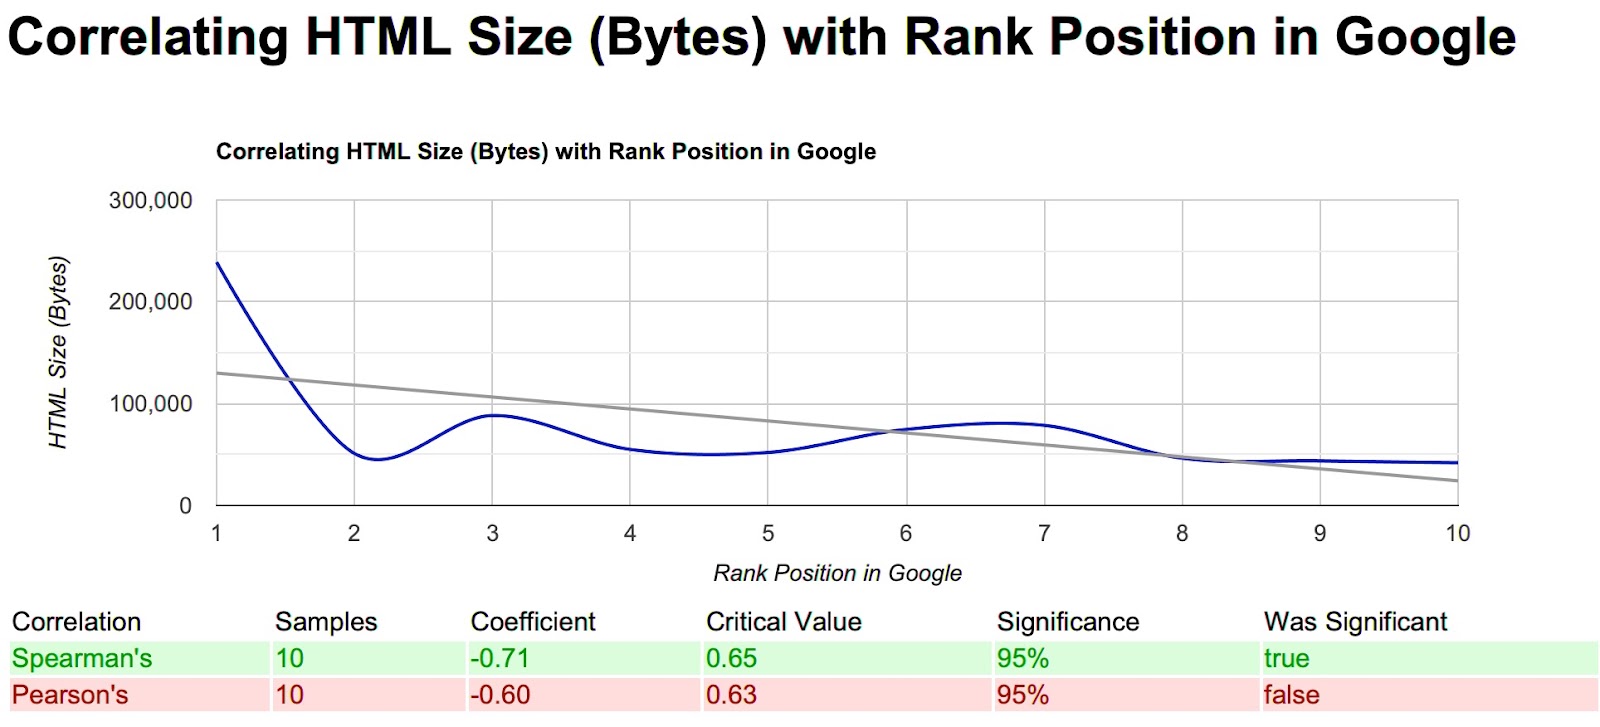
Here, that first keyword has some big pages ranking the in the top ten, everyone else, smaller compact sites (relatively, there are still some big ones).

No idea what HTML count could be measuring, but the numbers were all over the map and clearly don’t matter.
But size seems to.
Especially in the top 10 of the search results.
So all those “it’s a tie-breaker” people might be right.
The site that uses the least amount of code wins.
Why didn’t Google just say that, whats with all the Core Web Vitals, Lighthouse, CrUX BS?
Well, that’s how they got you to clean up your code, duhhhhhhh.
Analysis/Implications/Application: So clean code writing in the most concise way is how you leverage “page speed optimization” from a rankings perspective.
Make sure anything you, or your dev team, or SEO, add to your websites are written with clean code that only puts what it needs to display the page in the source.
Find clean themes or website builder tools run by dev teams that understand that and keep your code clean and tidy.
That, by the way, is what EVERYONE I’ve talked about CWV’s to who said they got an improvement did to achieve it.
It wasn’t because they got a green signal or an A, but if that’s what floats your boat, have at it.
